Background
Australian water management has undergone a significant period of reform over the past three decades. The establishment of water markets has been a key component of this reform story.
Water markets are now an established part of agricultural, urban and environmental water policy, management and investment in Australia.
The Aither Water Markets Report provides an overview of current water market activity in the southern Murray–Darling Basin, compares market outcomes with recent years and comments on the future outlook.
Download the PDF here

About Aither
Our Water Market Services
We are a team of award-winning, independent water markets, policy, and infrastructure advisors.
Every day, we help businesses and governments make better decisions about scarce water resources.
We do this by providing high-quality information, insights and analysis that help our clients design and implement strategies for successfully participating in Australia’s water markets. Our team also provides policy, regulatory and infrastructure advisory services.
Whether you need custom-designed water strategies or assessments of your exposure to water-related risks and opportunities, we’ll help you make clear, informed and confident water decisions.
Executive Summary
Facts at a glance – 2022-23
- Estimated value of commercial allocation trade in major southern MDB trading zones: $28 million.
- Annual average southern MDB allocation prices: $18 per ML in Vic 6 Murray (Dart to Barmah) to $37 per ML in SA Murray.
- Estimated value of major southern MDB entitlements on issue (including environmental and Victorian water corporation holdings): $32.3 billion.
- Aither Entitlement Index (AEI) 30 June 2023: 287 points (down 4% over 12 months).
- Value of total entitlement transfers: $718 million.
- Total volume of entitlement transfers or trades (outside of irrigation corporations): 156 GL (down 27% on 2021-22).
- Entitlement market turnover: 3%.
- Average annual high security and high reliability entitlement returns (sale of allocations): between 0.2% and 0.5%.
Summary of 2022-23
2022-23 was defined by a third consecutive year of above average rainfall across the southern Murray Darling Basin (MDB). Inflows to the Murray system were the 5th highest on record, and around double the volume of 2021-22. Whilst persistent rainfall kept allocation prices low, it was also the cause of many difficulties on-farm, including access, flooding and crop degradation.
Allocation markets
- Despite extensive annual summer crop plantings, persistent rain and flooding disrupted the operations of many irrigators, limiting water use. This combination of high supply and suppressed demand combined to drive allocation prices down across most of the year.
- The annual volume weighted average price for allocations across the southern Murray-Darling Basin was $27 per ML. Towards the end of 2022-23, markets trended to $0 in some systems due to limited private carryover space, a high risk of spill forecast for storages and the expectation of full allocations to entitlements in 2023-24.
- Across 2022-23, interstate and inter-valley trade opportunities were among the most restrictive in recent years.
Entitlement markets
- Prices for most high reliability and high security entitlements continued increasing to record highs in 2022-23. However, the pace of growth was slower than in previous years as prevailing economic conditions (especially rising interest rates) saw prices begin to correct towards the end of 2022-23.
- Strong demand continued for carryover and the implementation of the new Goulburn to Murray trade rule saw prices for low reliability entitlements, in particular Goulburn and Vic Murray 6, increase for the third year in a row. General security entitlement prices also increased (as is expected during a wet cycle) but began correcting towards the end of the year on the expectation a forecast El Niño may reduce allocations to these entitlements.
Facts at a glance – Outlook
- Comparison of 2022-23 and 2023-24 opening season allocations to consumptive users (excluding carryover): 250 GL more water allocated at opening of 2023-24
- Estimated 2022-23 total volume of water available to southern MDB consumptive users before peak irrigation season under average inflows scenario (including carryover): approximately 6,630 GL.
- Bureau of Meteorology three-month rainfall outlook (August to October) for southern MDB: Below average.
- Current (early August 2023) southern MDB allocation prices: $70 to $130 per ML.
Outlook for 2022-23
The 2023-24 water year began with maximum new season allocations to most entitlements and a record volume of consumptive carryover water provides high certainty of water availability for the year ahead. Whilst major southern MDB storages remain full, irrigators are expecting another year of low allocation prices. This may be tempered by a dry weather outlook, which could place upward pressure on prices at the back end of the season.
Allocation markets
- If the current El Niño forecast eventuates (early August 2023), allocation prices could remain steady or increase from current levels. What happens at the end of the year will depend on how far storages are drawn down and what the climate outlook is for 2024-25.
- Downstream trade opportunities will likely remain limited, and trade into NSW remains restricted in the short term due to the risk of storages spilling as a result of trade.
- Water demand from annual croppers in the Murrumbidgee could be a key driver as a dry summer may see higher allocation prices in the Murrumbidgee than in the Lower Murray.
Entitlement markets
- A potential Commonwealth Government buyback program associated with Basin Plan delivery could increase entitlement prices while active, but short-term uncertainty persists due to rising interest rates and soft demand.
- Given current prices and dynamics, the long-term outlook for entitlement markets is very uncertain.
- Access to carryover space remains an important risk management tool, high demand will continue to place upward pressure on prices for low reliability entitlements. However, the market may have peaked for now.
1.1 Introduction
Now in its tenth year, the Aither Water Markets Report provides water market participants, advisors, investors, and policy professionals with an annual snapshot of recent water market drivers and activity in the southern connected Murray-Darling Basin (MDB) (Figure 1).
This year’s report highlights the key drivers of the low water allocation prices observed in 2022-23 compared to the last three years, including:
We also highlight the slowdown in price growth for high reliability and high security entitlement prices in the face of rising interest rates and inconsistent buyer demand. Countering this is the prospect of a federal government buyback which could increase prices in the short-term.
As we look ahead from August 2023 (the time of writing), our outlook for 2023-24 explores how these factors may influence water markets in the southern MDB over the next 12 months.

Figure 1. Water trading zones in the southern Murray-Darling Basin.
Source: Aither, 2023.
Note: For the purposes of this report, Aither has defined the southern MDB as comprising of the Vic Goulburn, Vic Murray, NSW Murray, NSW Murrumbidgee, and SA Murray.
Aither Entitlement Index
As the only index of its kind in Australia, the Aither Entitlement Index (AEI) provides a simple, consistent, and reliable snapshot of water entitlement performance throughout the southern MDB.
Following a decade of consistent growth, the 2022-23 water year marks the first time the AEI has fallen on an annual basis since 2012-13. The AEI decreased by 4% across the year, compared to 18% growth in 2021-22 and 6% growth in the previous two water years (2020-21 and 2019-20).
The AEI plateaued through the first half of 2022-23, before reaching an all-time high in February and starting to decline. The largest monthly decrease was between February and March by 2.6%, followed by April to May at 1.3% (Figure 2).
The Aither Entitlement Index tracks the performance (capital value) of a group of major water entitlements across the southern MDB.
The AEI finished the year 4% below its all-time high of February 2023. The Compound Annual Growth Rate (CAGR) of the AEI is 7% since its inception in 2008-09. Since 2015‑16, when entitlement prices began to rapidly appreciate, the CAGR is 15%.
Aither’s independent water market specialists update the AEI every month using our in-house southern Murray-Darling Basin water asset valuations. The AEI supports better decision-making by providing irrigators, investors, banks and other water owners with a reliable benchmark to track the capital value performance of water portfolios and investments, and attract new investors.

Figure 2. Aither Entitlement Index, 2008-09 to 2022-23.
Source: Aither, 2023.
2.1 Climatic Conditions
Record flooding in the southern MDB.
2022-23 saw record wet conditions, resulting in flooding not seen in 50 years. The wet conditions and above-average rainfall persisted well into summer across the southern MDB (Figure 3).
Most of the southern MDB received between average to above average rainfall between August and January. Conditions then reverted to between average to below average rainfall from February (April and June were exceptions).
The wet conditions were driven by a negative Indian Ocean Dipole (IOD) in winter-spring, and a La Niña event over spring-summer.
The Bureau of Meteorology (BOM) declared a negative IOD in August 2022, which persisted until December 2022. Meanwhile, a third consecutive La Niña event was declared in September 2022, persisting until March 2023. The overlap between the two events between September and November brought record rainfall and floods to south-eastern Australia, peaking in October 2022.
The BOM declared an El Niño Alert in June 2023, indicating drier conditions are more likely into 2023-24.
The northern Basin was affected by the La Niña and negative IOD with average rainfall. At the end of the water year, NSW rural storages in the central and northern valleys were almost or completely full, except Pindari Dam (WaterNSW, 2023).

Figure 3. Rainfall deciles for the Murray-Darling Basin, 1 July 2020 to 30 June 2023
Source: Aither 2023. Based on Bureau of Meteorology, 2023.
2.2 Storages
Record inflows and suppressed water demand kept storages full for most of the year.
Record floods suppressed irrigator water demand, keeping storages full for most of the year. At the end of the water year, there was 13,426 GL in southern MDB storages. This is the largest end of year volume since our data commences in 2000-01.
The volume of water held in southern MDB storages peaked at 14,475 GL in November 2023. Peak volumes typically between early-September and late-November since 2011-12 (Figure 4).
In-crop rainfall suppressed demand and floods disrupted on-farm operations, limiting drawdown to 2,044 GL (outflows exceed inflows). This is the fifth smallest irrigation season drawdown since the break of the Millenium Drought in 2010-11. Much of the water released was part of airspace management to mitigate flood risks.
This year, Aither included the Menindee Lakes in Figure 4. Significant flows from the Barwon-Darling filled the lakes for the second year in a row. The Lakes support deliveries into the lower Murray which reduces reliance on upstream storages. Their inclusion in Figure 4 provides a more complete picture of southern MDB storages. Compared to 1 July 2022, on 30 June 2023:

Figure 4.Volume held in storage, southern Murray-Darling Basin major headwater storages, January 2000 to June 2023.
Source: Aither 2023. Based on Bureau of Meteorology, 2023.
Note: Murray storages include Lake Hume and Dartmouth, Murrumbidgee storages include Blowering and Burrinjuck.
Note: Volumes presented are accessible storage volume. This is the volume of water that can be accessed under normal circumstances and equals the total storage volume excluding dead storage volume. See Figure Notes
2.3 Allocations
Largest total volume of water allocated to major southern MDB entitlements in the last 16 years.
The total volume of water allocated to major southern MDB entitlements (including environmental water holdings) exceeded last year to become the highest observed since Aither’s data series commenced in 2007-08. Total water allocations were 7,942 GL, 6% more than the volume of water allocated in 2021-22 (approximately 444 GL). It is also 1,040 GL more than the volume allocated in the last wet year, 2016-17 (Figure 5).
This means average annual new season water availability in the last three years (2020-21 to 2022-23) is 7,189 GL. This is 363 GL above the average of the La Niña period following the Millenium Drought (2010-11 to 2012-13) – 6,826 GL.
The major drivers behind record new season water allocations were:

Figure 5. Estimated total volume of water allocated to major water entitlements in the southern Murray-Darling Basin, 2007-08 to 2022-23.
Source: Aither 2023. Based on Victorian, New South Wales and South Australian water registers, 2023.
Note: Allocations to all entitlement categories are shown, including allocations to environmental water and Victorian water corporation holdings. Excludes carryover and distributions from irrigation corporations.
Full allocations for the third year in a row.
For the third year in a row, there were full allocations to major southern MDB entitlements in all systems (excluding LRWS). Vic Murray LRWS also received 100% for the second year in a row (and since unbundling).
Most entitlements received their full allocation earlier than 2021-22, well before the summer irrigation period. This provided irrigators certainty about their water availability (Figure 6).
SA Murray opened with 100%, Vic Murray HRWS and Vic Goulburn HRWS reached 100% before September, before peak irrigation season. This is at least one month earlier than 2021-22 when these entitlements reached 100% by October. Similarly, NSW Murray HS and NSW Murray GS reached 100% and 110% respectively by September – two months earlier than last year.
NSW Murrumbidgee HS and NSW Murrumbidgee GS were exceptions, reaching 100% in January – two months later than 2021-22 (November). This was driven by a lack of early season usage, required to create airspace in storages to capture inflows to support full allocation.
2022-23 saw Vic Goulburn LRWS entitlements receive an allocation for the first time, and along with Vic Murray LRWS both received 100% in 2022-23. Initial allocations to both entitlements occurred between September and October – before quickly increasing to 100% between November and December.
Allocations to Murray and Goulburn LRWS entitlements meant water carried over on these entitlements from 2021‑22 was moved into spillable accounts, all of which subsequently spilled.
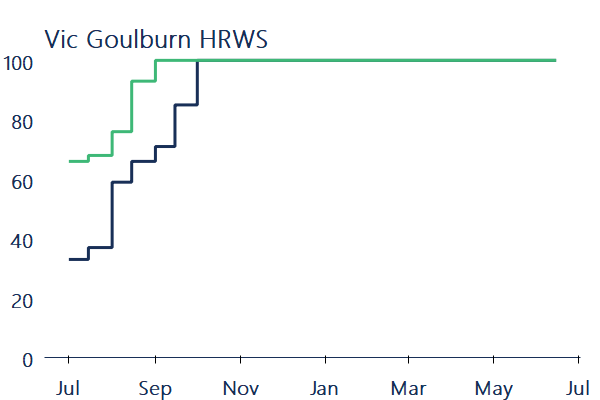
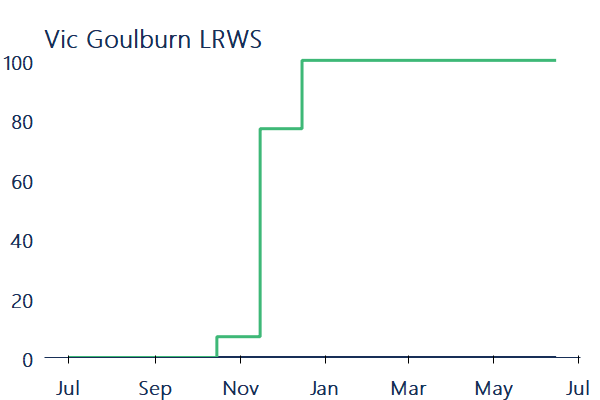
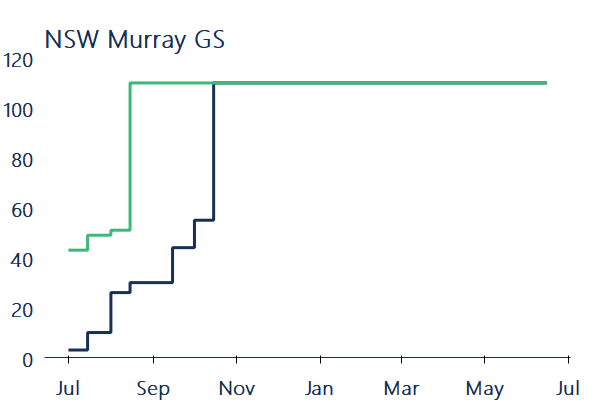
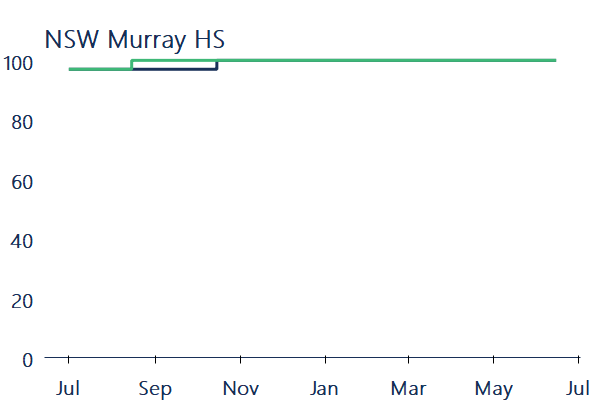

Figure 6. Water allocation determinations made to major southern Murray-Darling Basin entitlements, 2021-22 and 2022-23.
Source: Aither 2023. Based on Victorian, New South Wales and South Australian water registers, 2023.
2.4 Cropping patterns
Wet conditions in the first half of 2022-23 were observed across all southern MDB annual cropping regions. Monthly rainfall before summer was above median in most regions (peaking in October). February was the driest month of 2022-23, after which monthly rainfall generally trended at or below median (Figure 7).
2022-23 marked the third year in a row of high early season allocations to NSW general security entitlements, providing encouragement to annual croppers. However, on-farm rainfall and flooding in parts of the southern MDB disrupted some irrigation operations. This led to planting and irrigation being postponed, or in some instances cancelled.
Compared to 2021-22, the area planted to cotton in NSW only increased 2% (406,000 to 413,000 ha). It was still the second-highest in the last seven years. Summer flood disruptions meant the area planted to rice in NSW decreased 17% (62,000 ha to 51,000 ha) (ABARES, 2023). This area is still higher than the 5-year average to 2021-22 (35,000 ha).
In-crop rainfall led to limited additional watering of summer crops and in many cases created harvest issues. This meant the annual water use for many irrigators was well below average.
Similar to 2021-22, rainfall in Mildura and Berri was generally lower than in the upstream regions. Despite this, a wet spring and summer in 2022-23, along with flooding in South Australia eliminated any long-term rainfall deficits over the last four years in the lower Murray.
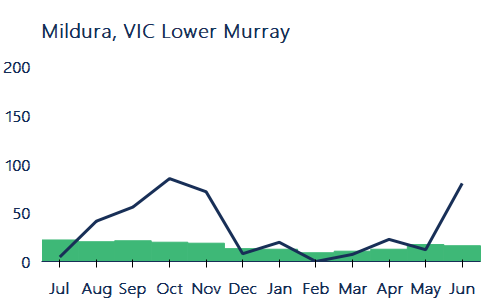
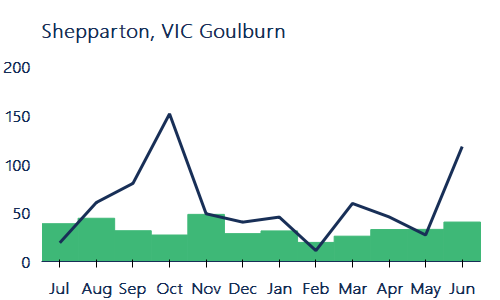

Figure 7. Water allocation determinations made to major southern Murray-Darling Basin entitlements, 2021-22 and 2022-23
Source: Aither 2023. Based on Bureau of Meteorology, 2023.
Note: Time period over which median rainfall is calculated varies by location. See Figure Notes.
Left axis – Monthly rainfall (mm)
2.5 Demand for water
Water use across the southern MDB down from 2021-22.
Total water use in NSW and Victoria (including usage against held environmental water accounts) was lower than 2021-22 volumes, decreasing by 23% (Figure 8). Despite record water availability, summer floods and in-crop rainfall disrupted irrigation operations and suppressed water demand.
Total water usage in the Murrumbidgee decreased 20% from 2021-22 (1,352 GL in 2021-22 to 1,077 GL in 2022-23) and was 27% lower than 2016-17 (1,477 GL). Despite maximum allocations to NSW Murray GS entitlements, flooding and in-crop rainfall suppressed water use in the NSW Murray, down 34% from 2021-22, and down 39% from 2016-17.
Across both NSW Murray and Murrumbidgee, this is the third lowest usage since 2016-17, with usage only lower in 2018-19 and 2019-20 when drought conditions and high allocation prices dominated.
In-crop rainfall meant water usage in the Victorian Murray was also down 14% from 2021-22 to 1,060 GL, the smallest drop of the four systems. However, this is still the lowest usage in 10 years (since 2013-14).
A similar trend was seen in the Goulburn with water use down 29% to 766 GL, the second lowest since 2013-14 as significant flooding and in-crop rainfall disrupted on-farm operations.

Figure 8. Water usage in the Murrumbidgee, Murray (Victoria and NSW only) and Goulburn systems, 2016-17 to 2022-23.
Source: Aither 2023. Based on Victorian and New South Wales water registers, 2023.
Note: Water usage in the NSW Murrumbidgee and Murray is based on usage against HS and GS entitlements only (consumptive and environment). Water usage in the Victorian Murray and Goulburn is based on usage against HRWS and LRWS accounts in Vic 1A Greater Goulburn, Vic 6 Murray and Vic 7 Murray.
2.6 Implications for the Market
Persistent in-crop rainfall and floods put downward pressure on allocation prices.
For the third year in a row, water allocation prices decreased throughout 2022-23. The annual volume weighted average price (VWAP) across major trading zones in the southern MDB was $27 per ML in 2022-23 (Figure 9).
Wet conditions from 2021-22 persisted into 2022-23. As a result, entitlements received their maximum allocations. However demand was suppressed due to sustained in-crop rainfall, and flooding between October and January disrupted on-farm operations. By the end of the season, allocation prices had collapsed toward zero due to lower autumn demand and the exhaustion of secure carryover opportunities (against LRWS/GS).
The last time we experienced three years of consecutive price reductions was following the Millennium Drought, between 2009-10 and 2011-12. Prices decreased during this time from $144 per ML in 2009–2010 to $19 in 2011–2012 as a result of an extended La Niña. Similarly, prices were $132 per ML in 2020-21 before falling 80% to $27 per ML in 2022-23.
A key difference between these two periods was:
- In 2022-23, the water available was 18% higher than in 2011-12, but the annual VWAP of $28 per ML was higher than the annual VWAP in 2011-12 when it was $19 per ML.
Total water availability in 2022-23 was down 2% from 2021‑22. This is because of water carried over on Goulburn entitlements which split in 2022-23.

Figure 9. Annual and monthly volume weighted average prices, and total water available to major entitlements in the southern Murray-Darling Basin (including carryover), 2007-08 to 2022-23.
Source: Aither 2023. Based on Victorian, New South Wales and South Australian water registers, 2023.
Note: High Reliability / Security and Low Reliability / General Security entitlements are included for the following zones: NSW Murray 10, NSW Murray 11, NSW Murrumbidgee, Vic 1A Greater Goulburn, Vic 6 Murray, Vic 7 Murray, and SA Murray HS (Class 3). See Figure Notes.
See Figure Notes.
3.1 Allocation Trade Prices
After three years of allocation price decreases, 2022‑23 was still higher than 2011-12 prices.
For the third year in a row, annual water allocation prices decreased in 2022-23. Compared to prices in 2021‑22, annual volume weighted average prices (VWAPs) were between 61% and 73% lower across the major trading zones in the southern MDB (Table 1).
Annual VWAPs for 2022-23 were up to 86% lower than 2020-21 when wet conditions began. Prices fell close to 2011-12 levels which was also preceded by two consecutive years of wet conditions (La Niña).
Despite the similarities, 2022-23 annual VWAPs across all zones are still higher than 2011-12 annual VWAPs. This was most evident in the lower Murray where 2022-23 prices were between 6% (NSW 11 Murray) and 97% (Vic 7 Murray) higher than 2011-12 VWAPs. This likely reflects a reduced consumptive pool (a result of water recovery) and increased fixed demand from perennial horticulture.
Downstream zones in 2022-23 continue trading at a premium compared to upstream zones. NSW 11 Murray was an exception, trading between $0 per ML and $6 per ML above NSW 10 Murray. This was partly due to trade restrictions into and out of NSW, reducing access and putting downward pressure on prices.
The estimated value of commercial allocation trade in major southern MDB trading zones was $28 million. This is lower than the $94 million reported in 2021-22 as well as the $60 million reported in 2016-17. However, this is still higher than the estimate of commercial allocation trade in 2011-12 ($11 million).
Table 1. Annual volume weighted average prices, major southern Murray-Darling Basin trading zones, 2020-21 to 2022-23.
| Trading zone | VWAP 2020-21 ($/ML) | VWAP 2021-22 ($/ML) | VWAP 2022-23 ($/ML) | Change in price 2021-22 to 2022-23 (%) | Change in price 2020-21 to 2022-23 (%) |
|---|---|---|---|---|---|
| Vic 1A Greater Goulburn | $116 | $54 | $21 | -61% | -82% |
| Vic 6 Murray (Dart to Barmah) | $129 | $59 | $18 | -69% | -86% |
| Vic 7 Murray (Barmah to SA) | $160 | $89 | $33 | -63% | -79% |
| NSW Murray (above Barmah) | $95 | $66 | $24 | -63% | -74% |
| NSW Murray (below Barmah) | $154 | $86 | $24 | -73% | -85% |
| NSW Murrumbidgee | $96 | $57 | $21 | -63% | -78% |
| SA Murray | $191 | $104 | $37 | -64% | -81% |
3.2 Comparison of Allocation Trade Prices
Allocation prices continued to trend downwards in 2022-23.
Following a fall in allocation prices of around 85% across 2021-22, persistant rainfall at the start of 2022-23 saw the lowest opening allocation prices across all major systems since 2013-14. From July to October, continued rainfall and high water availability across the Basin put further downward pressure on prices (Figure 10).
The lower Murray and Goulburn were the only systems where weekly VWAPs increased over the summer irrigation period. Both zones traded at ~$35 per ML after trade opened from the Goulburn to the Murray. In contrast, weekly VWAPs in the upper Murray held steady at around $20 per ML. After summer, cooler temperatures, autumn rain and high-water availability continued to push prices down. July 2022 to June 2023 saw among the largest drops in weekly allocation VWAPs since 2007-08 (80% to 94%).
The lowest weekly VWAPs, based on water register data, for each trading zone were:
- Combined Goulburn $8 per ML (mid-May).
- Murray (above Barmah) $8 per ML (mid-March).
- Murray (below Barmah) $8 per ML (end-June).
- Murrumbidgee $2 per ML (end-June).
The risk of spill caused by trade into NSW saw the closure of trade between NSW and Victoria. This restriction drove price separation between the states.

Figure 10. Weekly volume weighted average prices, major southern Murray-Darling Basin trading zones, 2022-23.
Source: Aither, 2023. Based on Victorian, New South Wales, and South Australian water registers, 2023.

Figure 11. Weekly transfer and trade volumes (within and into), major southern Murray-Darling Basin trading zones, 2022-23.
Source: Aither, 2023. Based on Victorian, New South Wales, and South Australian water registers, 2023.
3.3 Allocation Trade Activity
Wet conditions reverse the typical net commercial trade from Vic 7 Murray.
Allocation transfer trends across the southern MDB in 2022‑23 remain broadly consistent with historical trends. As with the last five years, 2022-23 saw Vic 7 Murray as the largest net exporter of water allocations, and SA Murray as the largest net importer. However, both had their lowest level activity levels since 2020-21. Vic 1A Goulburn was a net importer in 2022-23, changing from a net exporter of 17 GL in 2021-22.
The analysis in Table 2 contains all water transfers, including those recorded on water registers at $0 and other non‑commercial transactions (such as environmental transfers), these can be substantial in volume. Estimates of commercial water allocation trade activity are made by excluding $0 transfers (Table 3).
The 2022-23 net change in commercial trade for Vic 7 Murray was -78 GL, making this zone a net exporter for the first time since 2017-18. This shows how wet conditions suppressed demand despite recent growth in permanent horticulture. Continuing a four-year trend, NSW 11 Murray was a net exporter (-60 GL), trade restrictions kept this figure at its lowest level over the same period.
Vic 1A Goulburn remains a net importer (+48 GL), the second highest since 2019-20. This shows continued demand for carryover space in the Goulburn despite a high risk of spill forecast for 2023-24 (>90%) – driven by low allocation prices this year and expectations of drier conditions in 2023-24. The SA Murray was a net importer for the second year in a row, despite in recent history being a net exporter of commercial allocation trade.
Table 2. Allocation transfer numbers and volumes, major southern Murray-Darling Basin trading zones (all reported trades) 2022-23.
| Trading Zone | Within
| Into
| Out of
| Net Change (ML) | |||||||||
|---|---|---|---|---|---|---|---|---|---|---|---|---|---|
| Vic 1A Greater Goulburn | 2,976 | 930,638 | 1,023 | 350,080 | 614 | 337,566 | 12,514 | ||||||
| Vic 6 Murray (Dart to Barmah) | 927 | 338,863 | 172 | 96,133 | 253 | 117,866 | -21,733 | ||||||
| Vic 7 Murray (Dart to Barmah) | 3,315 | 706,524 | 840 | 380,469 | 959 | 867,204 | -486,735 | ||||||
| NSW Murray (above Barmah) | 86 | 296,464 | 35 | 25,420 | 42 | 44,302 | -18,882 | ||||||
| NSW Murray (below Barmah) | 690 | 182,833 | 139 | 154,043 | 268 | 241,614 | -87,571 | ||||||
| NSW Murrumbidgee | 808 | 642,680 | 68 | 41,835 | 108 | 123,724 | -81,889 | ||||||
| SA Murray | 648 | 306,523 | 385 | 648,007 | 189 | 105,717 | 542,290 | ||||||
| Total | 9,450 | 3,404,524 | 2,662 | 1,695,986 | 2,433 | 1,837,993 | |||||||
Table 3. Allocation transfer numbers and volumes, major southern Murray-Darling Basin trading zones (priced trades, i.e., excluding $0 transfers) 2022-23.
| Trading zone | Within
| Into
| Out of
| Net change (ML) | |||||||||
|---|---|---|---|---|---|---|---|---|---|---|---|---|---|
| Vic 1A Greater Goulburn | 2,099 | 350,536 | 721 | 144,949 | 414 | 96,840 | 48,109 | ||||||
| Vic 6 Murray (Dart to Barmah) | 715 | 126,702 | 116 | 18,053 | 42 | 8,623 | 9,430 | ||||||
| Vic 7 Murray (Dart to Barmah) | 2,467 | 380,692 | 407 | 71,998 | 677 | 150,102 | -78,104 | ||||||
| NSW Murray (above Barmah) | 38 | 19,576 | 12 | 8,850 | 2 | 600 | 8,250 | ||||||
| NSW Murray (below Barmah) | 472 | 89,419 | 38 | 7,899 | 148 | 67,845 | -59,946 | ||||||
| NSW Murrumbidgee | 585 | 310,254 | 43 | 17,663 | 41 | 16,158 | 1,505 | ||||||
| SA Murray | 251 | 39,178 | 263 | 84,426 | 123 | 39,362 | 45,064 | ||||||
| Total | 6,627 | 1,316,356 | 1,600 | 353,837 | 1,447 | 379,528 | |||||||
3.4 Comparison of allocation market activity
Allocation markets quiet over summer with floods and in-crop rainfall reducing demand.
Following two wet years, a third La Nina event resulting in above-average rainfall on top of already record water availability meant that allocation markets were quiet. This occurred despite above-average cropping levels.
Reduced allocation market transfer and trade activity was especially evident in the NSW Murrumbidgee, down 30% from 2021-22.
Combined trade and transfer activity in the lower Murray (NSW 11 Murray, Vic 7 Murray, and SA Murray) increased by only 2% compared to last year. Similar results were seen above the Barmah Choke (Vic 6 Murray and NSW 10 Murray), up 2%. However, Vic 6 Murray saw a 26% increase in the volume of annual transfers and trades compared with 2021-22 (Figure 12).
From October to December, allocation market activity was especially quiet – reflecting the impact of floods and in-crop rainfall disrupting irrigation operations and suppressing water demand.
As market participants looked to carry over, total allocation market activity across the southern MDB began picking up in the final months of the water year. However, this was still down 13% across the same period in 2021-22.
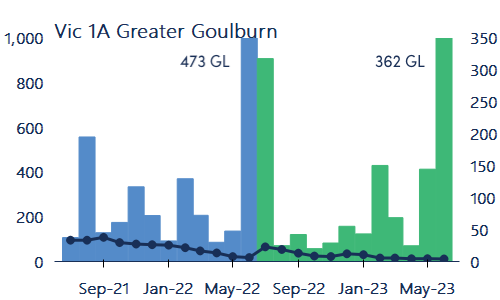
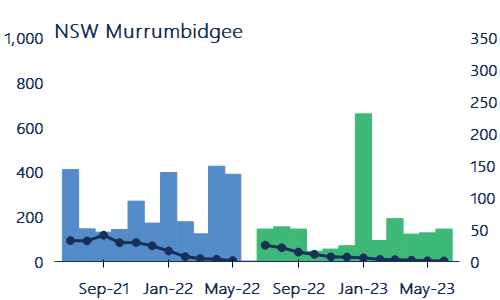
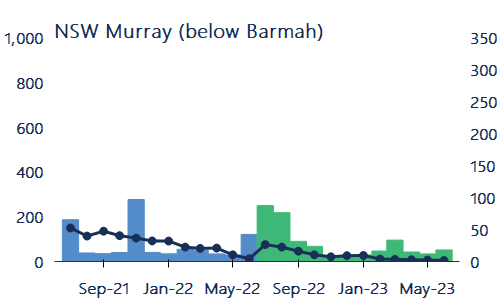
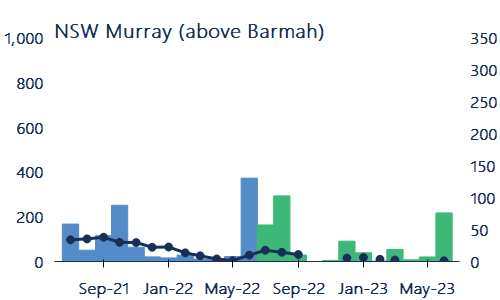
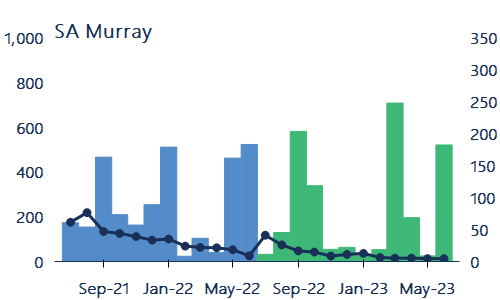
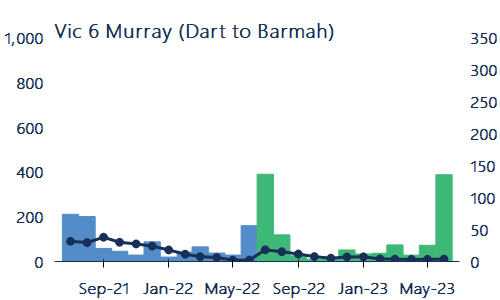
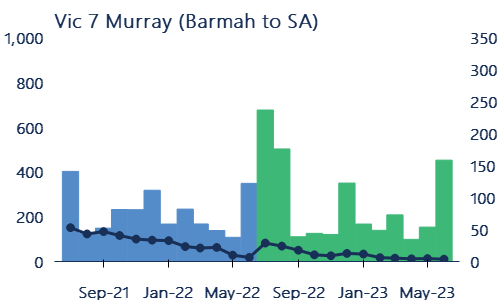

Figure 12. Monthly volume weighted average prices, and transfer and trade volumes (within and into), major southern Murray-Darling Basin trading zones, 2021-22 to 2022-23.
Source: Aither, 2023. Based on Victorian, New South Wales, and South Australian water registers, 2023.
See Figure Notes.
3.5 Allocation trade activity in the upper Murray
Upper Murray allocation trade activity decreased by 16% compared to 2021-22.
Data for water market trade activity in irrigation corporations is important. It enables market participants to build a more complete picture of trade activity than can be done with state water register data alone.
Although data on irrigation corporation trade activity is limited, Murray Irrigation Limited provide aggregated daily water allocation sales data on its website. Continuing from last year, Aither combined this data with data from the NSW and Victorian water registers to show what happened in the upper Murray in 2021-22.
In 2022-23, 298 GL of allocations were traded in the upper Murray. This compares to 354 GL in 2021-22.
Trade volumes fluctuated monthly in 2022-23, hitting a low point before summer due to floods and rainfall reducing water demand. Activity increased in March 2023 with winter cropping, as irrigators looked at opportunities to grow winter crops.
Trade activity in June 2023 was 24% higher than in June 2022. This likely reflects cheap allocation prices and a dry outlook for allocations to NSW Murray GS entitlements driving carryover demand. This is also supported by expectations of a 61 GL opening for trade across the Barmah Choke on July 1, 2023.

Figure 13. Monthly allocation transfer and trade volumes, NSW and Victorian Murray (above Barmah) 2022-23.
Source: Aither, 2023. Based on NSW and Victorian water Murray Irrigation Limited website, 2023.
Note: Volumes from the NSW and Victorian water registers include all priced trades (within and into zones 6 and 10). Volumes transferred or traded within Murray Irrigation Limited were accessed 28 June 2023.
3.6 Trade constraints
Trade constraints were binding in 2022-23
Trade constraints limit moving water allocations between southern MDB markets. This can alter water supply and demand dynamics within and between regions, driving price differences between trading zones.
As expected, downstream trade opportunities opened on 1 July 2022:
- 41 GL upper Murray to lower Murray (MDBA, 2023).
- 83 GL Goulburn to lower Murray (VWR, 2023)
Despite limited downstream trade opportunities through the Barmah Choke, weekly VWAPs between the upper and lower Murray remained close to parity after February due to limited market activity.
The Goulburn to Murray trade rule was implemented in full for the 2022-23 water year. After a delayed initial opening on 7 July, the October opening was postponed due to the Victorian floods. After the 15 December opening, there was a continuous open period until January (Figure 14).
The maximum weekly VWAP price differentials were:
- Goulburn & lower Murray: $35 per ML (early-July)
- Upper Murray & lower Murray: $42 per ML (early-July)
- Murrumbidgee & lower Murray: $19 per ML (early-Jan)
The risk of spill saw interstate trade restrictions into NSW, along with trade from NSW into Victoria – creating the most restrictive trading conditions for interstate trade.


Figure 14. Upstream to downstream trade opportunities (end-of-day) during 2022-23 with weekly allocation volume weighted average prices showing price divergence and equalisation.
Source: Aither, 2023. Based on Victorian and New South Wales water registers, 2023.
See Figure Notes.
3.7 Purpose of allocation trade
NSW and Victorian governments provided comprehensive and informative trade information for allocation transfers and trades in 2022-23, the second full year of reporting purposes for trade data.
A purpose for trade was attached to 99% of the priced trade volume (21-22: 98%) and 79% of the $0 trade volume (21‑22: 72%). Figure 14 shows the monthly volume of priced and $0 allocation transfers or trades by reason.
A large portion of $0 trade volume without a listed purpose can be attributed to 10 environmental trades transacted in Victoria through July-August (475GL). When these trades are excluded, 97% of reported $0 trades have a listed purpose.
The priced trade volume in 2022-23 was comprised of:
- 69% standard commercial trades.
- 13% delivery of allocations under forward contracts and entitlement leases.
- 13% carryover parking, with 54% of June trade being carryover parking.
The $0 trade volume in 2022-23 was comprised of:
- 48% related party transfers.
- 17% environmental use.
- 4% carryover parking return, mainly in July 2022 where it represented 13% of all allocation trades or transfers.


Figure 15. Volume traded by the purpose of trade in major Victorian and NSW southern MDB trading zones, 2022-23.
Source: Aither, 2023. Based on NSW and Victorian water registers, 2023.
See Figure Notes.
4.1 Entitlement trade prices
Annual entitlement VWAPs for prices hit record highs in 2023-23.
Annual VWAPs (based on state water register data) for all high reliability and high security entitlements rose in 2022‑23, and most reached record highs. Vic 1A Goulburn HRWS was an exception, below its 2019-20 peak of $4,485 per ML.
Following a third year of wet conditions and continued interest in carryover space, annual register VWAPs increased to record highs across all GS and LRWS entitlements. This was especially evident in Goulburn and Vic Murray 6 LRWS, and reflected market confidence in the implementation of the new Goulburn to Murray trade rule in 2022-23. The largest increase was for NSW Murray GS (a combination of Zones 10 and 11) – up 39%, driven by increased trading for Zone 11 GS which trades at a premium to Zone 10 GS.
Water register data shows annual entitlement price growth has slowed, pointing towards a price correction at the end of 2022-23, likely reflecting prevailing economic conditions – particularly rising interest rates.
Beware – VWAPs don’t tell the full story.
Whilst register VWAP data indicates a slowdown in entitlement price growth, it doesn’t tell the full story. There is often up to an eight-week lag between market activity and register information. This was particularly evident in the last four months of 2022-23, where Aither’s Fair Market Unit Value reports have shown a substantive drop in values. This is also reflected in the Aither Entitlement Index which fell 4% across the year (see Aither Entitlement Index).
Table 4. Annual transfer volumes and volume weighted average prices, major southern Murray-Darling Basin entitlements, 2021-22 and 2022-23.
| Entitlement type | No. traded | Volume traded (ML) | Annual VWAP ($/ML)
| Annual change in price (%) | Change in price 2020-21 to 2022-23 (%) | |||
|---|---|---|---|---|---|---|---|---|
| Vic 1A Greater Goulburn HRWS | 767 | 29,236 | $4,085 | $4,128 | 1.1% | 1% | ||
| Vic 1A Greater Goulburn LRWS | 368 | 20,572 | $638 | $869 | 36% | 102% | ||
| Vic 6 Murray (Dart to Barmah) HRWS | 169 | 10,108 | $4,904 | $4,997 | 2% | 12% | ||
| Vic 6 Murray (Dart to Barmah) LRWS | 93 | 6,562 | $669 | $850 | 27% | 57% | ||
| Vic 7 Murray (Barmah to SA) HRWS | 721 | 38,687 | $7,155 | $7,864 | 10% | 28% | ||
| Vic 7 Murray (Barmah to SA) LRWS | 134 | 15,203 | $1,729 | $1,819 | 5% | 96% | ||
| NSW Murray GS | 50 | 10,088 | $1,968 | $2,742 | 39% | 47% | ||
| NSW Murray HS | 72 | 5,265 | $8,856 | $9,352 | 6% | 12% | ||
| NSW Murrumbidgee GS | 28 | 9,170 | $2,457 | $2,610 | 6% | 29% | ||
| NSW Murrumbidgee HS | 21 | 2,978 | $8,246 | $9,109 | 10% | 27% | ||
| SA Murray HS | 188 | 7,698 | $7,473 | $8,268 | 11% | 21% | ||
| TOTAL | 2,611 | 155,567 | ||||||
Note: NSW Murray HS and NSW Murray GS are a combination of entitlement trades in zones 10 and 11. The aggregation of these data reflect the way NSW Murray HS and GS trades are reported on the NSW Water Register. Volume weighted average prices generated from state water register trade data may differ from market values. See Table Notes
4.2 Comparison of trade prices and volume
High reliability and high security entitlements
Monthly register VWAPs between July 2022 and June 2023 saw mixed movements across HRWS and HS entitlements but were overall steady. These are based on state water register data, which can often lag market prices. Market activity was generally lower than 2021-22 (Figure 16).
During 2022-23 monthly VWAPs for NSW Murray HS, SA Murray HS and Vic 1A Goulburn HRWS remained relatively steady, down 3%, 1% and 4% respectively from July 2022 to June 2023. Trade or transfer volumes decreased 32% for SA Murray HS and 19% for Vic 1A Goulburn HRWS compared to 2021-22.
Monthly VWAPs for Vic 7 Murray HRWS remained steady at around $7,800 per ML throughout 2022-23, despite a 4% decrease in market activity from 2021-22. However, VWAPs decreased to about $7,600 towards the end of the period.
Vic 6 Murray HRWS ran against the trend increasing by 6% in price during 2022-23, peaking in December 2022, on 25% lower volume than 2021-22. In contrast, market activity for NSW Murray HS (a combination of Zones 10 and 11) was up 104% compared to 2021-22 which was a particularly inactive year, pricing was steady.
NSW Murrumbidgee HS saw consistent monthly VWAPs of approximately $9,000 per ML, with market activity increasing by 17% compared to 2021-22.
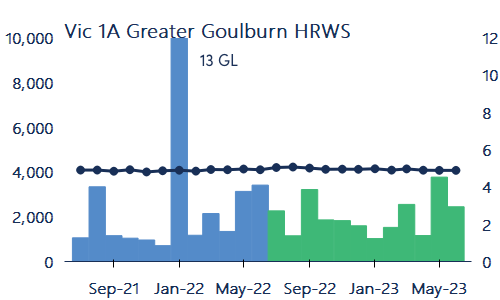
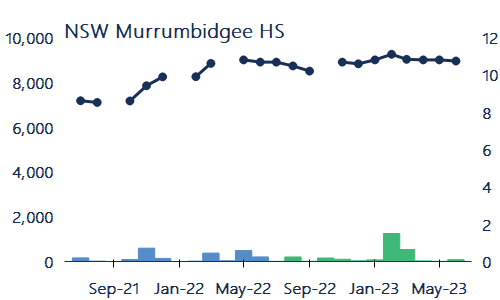
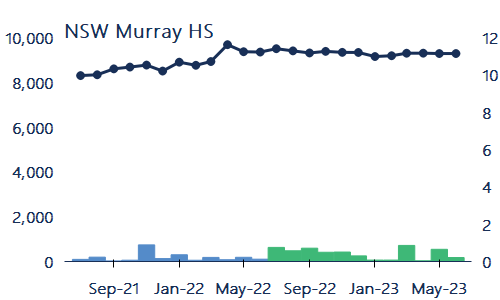
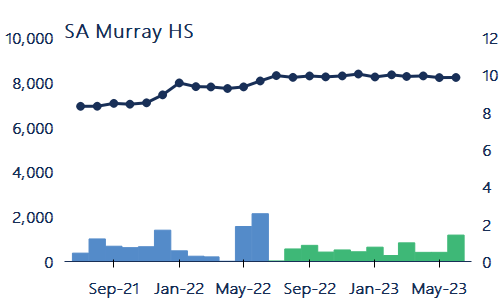
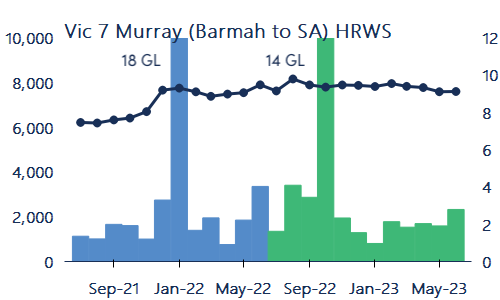

Figure 16. Monthly volume weighted average prices and transfer volumes (within and into), major southern Murray-Darling Basin high reliability and high security entitlements, 2021-22 to 2022-23 (based on water register data)
Source: Aither, 2023. Based on Victorian, New South Wales and South Australian water registers, 2023.
Note: NSW Murray HS is a combination of entitlement trades in zones 10 and 11. The aggregation of these data reflect the way NSW Murray HS trades are reported on the NSW Water Register.
Left axis- Volume weighted average price ($/ML)
Right axis – Volume of water traded (GL)
Low reliability and general security entitlements.
Monthly register VWAPs saw mixed movements through 2022‑23, and are based on state water register data, which often lag market prices. Vic 1A Greater Goulburn LRWS and Vic 6 Murray LRWS enjoyed the largest increases, 17% and 28% respectively between July 2022 and June 2023 (Figure 17). This reflects continued interest in secure carryover space and a vote of confidence in the new Goulburn to Murray trade rule.
Monthly VWAPs for Vic 7 Murray LRWS held steady between July 2022 and June 2023. Trade and transfer activity for this entitlement was up 81% from 2021-22, although this was driven by one commercial trade for 5 GL in July 2022. Excluding this trade, there was 20% increase in the volume traded or transferred.
Monthly VWAPs for NSW Murray GS (zones 10 and 11 combined) were down 39% in 2022-23, although this was driven by Zone 10 trade in June. Market prices for Zone 11 did soften to around $2,600 from $2,700 at the start of 2022-23. Monthly VWAPs for NSW Murrumbidgee GS also decreased in 2022-23, down 12% from August 2022. While this excludes trades in irrigation corporations, this softening likely reflects the drier outlook for 2023-24.
Market activity in NSW Murray and Murrumbidgee GS dropped significantly from 2021-22 to 2022-23, with a 55% and 78% decline respectively. Even with large, related party trades removed from June 22, there was a 49% decline.
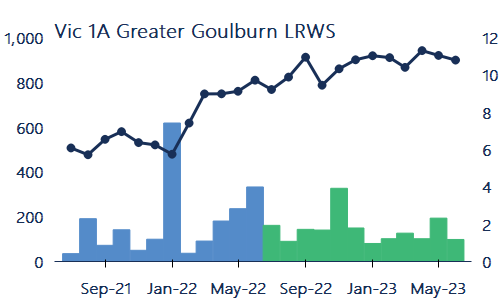
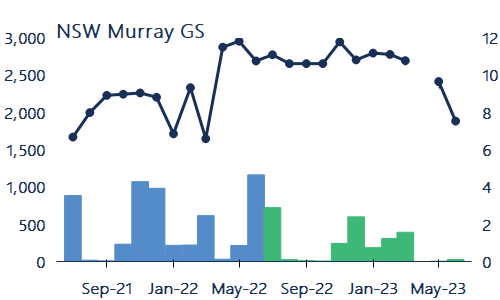
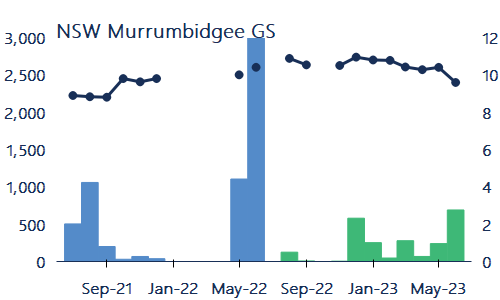
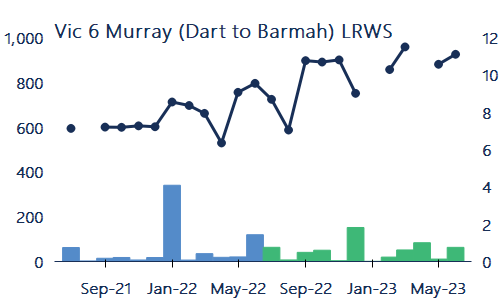
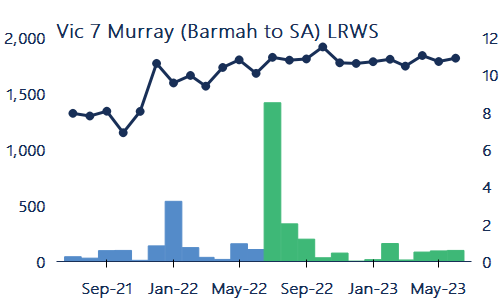

Figure 17. Monthly volume weighted average prices and transfer volumes (within and into), major southern Murray-Darling Basin low reliability and general security entitlements, 2021-22 to 2022-23.
Source: Aither, 2023. Based on Victorian, New South Wales and South Australian water registers, 2023.
Note: Price axes differ across the charts above, reflecting general price differences between entitlements. Vic 6 LRWS April 2022 VWAP is $529 per ML following a trade transacted at $500 per ML and the August 2022 VWAP is $586 per ML following a trade transacted at $403 per ML. These are both likely typographical errors in the register.
Note: NSW Murray GS is a combination of entitlement trades in zones 10 and 11. The aggregation of these data reflect the way NSW Murray GS trades are reported on the NSW Water Register. All statistics reported for NSW Murrumbidgee GS and NSW Murray GS exclude trades within irrigation corporations. See Figure Notes.
Left axis- Volume weighted average price ($/ML)
Right axis – Volume of water traded (GL)
4.3 Total entitlement market size and value
Value of southern MDB entitlements hits a new all-time high of $32 billion.
The majority of water entitlement trading in Australia occurs in the southern MDB. In 2022-23, the estimated total value of major entitlements on issue in the southern MDB rose 8% from 2021-22 ($30 billion, 13% higher than in 2020-21).
The estimated market value in 2022-23 was approximately $32.3 billion (Table 5). This estimate is based on state water register data, which often lags market prices. The AEI, which incorporates current market data, shows a 4% decline in value. This is likely driven in part by rising interest rates, broader economic headwinds and low allocation prices reducing entitlement yields.
With the entitlement on issue unchanged in 2022-23 compared to 2021-22, 30% of the increase was driven by increased annual VWAPs for Vic 7 Murray HRWS, closely followed by SA Murray HS (21%) and NSW Murrumbidgee HS (14%).
The increased value of entitlements on issue from 2021-22 follows a sharp rise in the previous year (13%), pointing to the gradual slowdown in entitlement prices. Since Aither first estimated the value of entitlements on issue in the 2014-15 Aither Water Markets Report, only four of the last nine years have seen annual growth below 10%.
The estimated value of environmental water holdings in the southern MDB increased 7% from 2021-22. In 2022-23, environmental water holdings represented around $8.3 billion or 26% of the total value of entitlements on issue.
Table 5. Volume of entitlements on issue, annual prices and estimates of market size, major southern Murray-Darling Basin entitlements, 2022-23.
| Entitlement type | Total estimated entitlement on issue (ML) | Estimated environmental held entitlements (ML) | VWAP ($/ML) 2022-23 | Estimated value of entitlements on issue (million) | Estimated value of environmental entitlements (million) |
|---|---|---|---|---|---|
| Vic 1A Greater Goulburn HRWS | 1,010,050 | 302,160 | $4,128 | $4,170 | $1,247 |
| Vic 1A Greater Goulburn LRWS | 443,320 | 49,090 | $869 | $385 | $43 |
| Vic 6 Murray (Dart to Barmah) HRWS | 326,770 | 117,340 | $4,997 | $1,633 | $586 |
| Vic 6 Murray (Dart to Barmah) LRWS | 135,510 | 18,180 | $850 | $115 | $15 |
| Vic 7 Murray (Barmah to SA) HRWS | 945,690 | 268,030 | $7,864 | $7,437 | $2,108 |
| Vic 7 Murray (Barmah to SA) LRWS | 184,750 | 23,390 | $1,819 | $336 | $43 |
| NSW Murray 10 GS | 1,301,236 | 364,760 | $1,727 | $2,247 | $630 |
| NSW Murray 10 HS | 22,811 | 4,499 | $7,328 | $167 | $33 |
| NSW Murray 11 GS | 372,860 | 119,913 | $2,708 | $1,010 | $325 |
| NSW Murray 11 HS | 166,894 | 20,510 | $9,313 | $1,554 | $191 |
| NSW Murrumbidgee GS | 1,892,000 | 478,391 | $2,610 | $4,938 | $1,249 |
| NSW Murrumbidgee HS | 364,426 | 11,984 | $9,109 | $3,320 | $109 |
| SA Murray HS | 608,000 | 207,000 | $8,268 | $5,027 | $1,711 |
| Total | 7,774,316 | 1,985,247 | | $32,339 | $8,290 |
Note: Note: The volume weighted average prices shown above are generated from state water register trade data. These may differ from market values. The Aither Entitlement Index is based on Aither’s in-house fair market unit values that its water market specialists generate each month. See Table Notes.
4.4 Entitlement market turnover and returns
Entitlement .
Market turnover is the volume traded or transferred as a proportion of the estimated consumptive entitlement on issue. For major entitlements in the southern MDB, market turnover varied between 1% and 9% (average of 3%) (Table 6).
The market turnover value for major southern MDB entitlements in 2022-23 was around $654 million, a 12% decrease compared to 2021-22 when the turnover value was $812 million (Table 6). This is the lowest turnover since the 2019-20 peak of $1.1 billion.
The decrease in market turnover was mainly driven by NSW Murrumbidgee GS which saw decreased volumes being traded or transferred (down 78% from 2021-22).
Compared to 2021-22, the number of trades or transfers decreased by 9% while the total volume traded or transferred decreased by 27%. This means the average parcel size of trades and transfers continued decreasing to its lowest level since unbundling.
A combination of higher entitlement annual VWAPs and lower allocation prices meant that the returns to all entitlements in 2022-23 were lower compared to 2021-22. Vic 1A Greater Goulburn LRWS was an exception, having recorded a return after receiving an allocation for the first time since unbundling.
Table 6. Entitlement market turnover and returns, major southern Murray-Darling Basin entitlements (outside irrigation corporations), 2022-23.
| Entitlement type | No. traded | Volume traded (ML) | Estimated turnover value (million) | Estimated turnover (%) | Average annual gross return (%) |
|---|---|---|---|---|---|
| Vic 1A Greater Goulburn HRWS | 767 | 29,236 | $121 | 4% | 0.5% |
| Vic 1A Greater Goulburn LRWS | 368 | 20,572 | $18 | 5% | 2.5% |
| Vic 6 Murray (Dart to Barmah) HRWS | 169 | 10,108 | $51 | 5% | 0.4% |
| Vic 6 Murray (Dart to Barmah) LRWS | 93 | 6,562 | $6 | 6% | 2.1% |
| Vic 7 Murray (Barmah to SA) HRWS | 721 | 38,687 | $304 | 6% | 0.4% |
| Vic 7 Murray (Barmah to SA) LRWS | 134 | 15,203 | $28 | 9% | 1.8% |
| NSW Murray GS | 50 | 10,088 | $28 | 1% | 1.5% |
| NSW Murray HS | 72 | 5,265 | $49 | 3% | 0.4% |
| NSW Murrumbidgee GS | 28 | 9,170 | $24 | 1% | 0.8% |
| NSW Murrumbidgee HS | 21 | 2,978 | $27 | 1% | 0.2% |
| SA Murray HS | 188 | 7,698 | $64 | 2% | 0.4% |
| Total | 2,611 | 155,567 | $718 | 3% |
Note: The gross average returns reported above are generated using a simple method to inspect market trends, not the performance of a particular investment. See Table Notes.
4.5 Groundwater markets
Second least active groundwater market in 10 years.
Market activity was at its second-lowest level since 2013‑14 while entitlement prices saw mixed movements between 2021-22 and 2022-23 (Figure 18). This was reflective of record surface water availability and high in-crop rainfall. With excess surface water irrigators generally did not need to access groundwater. Such wet periods typically see reduced interest and market activity for groundwater entitlements.
Between 2021-22 and 2022-23, annual VWAPs for:
- Lower Lachlan Groundwater saw no trades or transfers in 2022-23 – this is the first year of no trading and transfer activity since records began in 2008-09.
- Lower Murrumbidgee Deep Groundwater increased by 11%, from $3,551 per ML to $3,928 per ML (although this can be influenced by the zones of trade activity).
- Lower Murray Groundwater decreased slightly by 4%, from $2,646 per ML to $2,550 per ML.
This marks the second consecutive year of declining prices for groundwater entitlements.
During 2022-23, NSW Lower Murrumbidgee Deep Groundwater’s annual VWAPs increased due to two trades above $4,000 per ML in July and October 2023, this was prior to the record inflows and rainfall. However, trade and transfer activity was still down 44% from 2021-22.

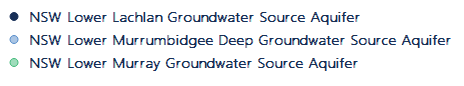
Figure 18. Individual water entitlement trades (priced trades only, $0 trades excluded) and volumes (bubble size), major groundwater entitlement markets, 2012-13 to 2022-23.
Source: Aither, 2023. Based on New South Wales Water Register, 2023.
Note: NSW Lower Murrumbidgee Deep Groundwater Source Aquifer is an aggregate of the three zones in this aquifer. This reflects the way in which trades for these entitlements are recorded on the NSW Water Register. See Figure Notes.
4.6 Northern MDB markets
Entitlement
Northern MDB entitlement markets are generally tightly held, and as a result, market activity tends to be lower. This also reflects their more limited hydrological connectivity and the fact that most transfers are associated with land transactions. Entitlement trades in the most active northern MDB markets are shown in Figure 19.
Annual trade and transfer activity for entitlements in the northern Basin during 2022-23 was at its lowest level since 2005-06 – 5.6 GL, compared to the 18‑year annual average of 34 GL.
Due to the limited number of trades, current market prices can vary significantly from VWAPs. Based on 71Q licence transfers (which tend to be unrelated to land transfers). Compared to 2021-22, annual VWAPs for general security entitlements in the northern Basin in 2022-23 were generally higher:
- NSW Macquarie and Cudgegong GS increased 72% from $1,835 per ML to $3,164 per ML.
- NSW Lower Namoi GS increased 28% from $3,450 per ML to $4,414 per ML.
- NSW Peel GS increased 4% from $1,350 per ML to $1,400 per ML.
NSW Lachlan GS was an exception, decreasing 2% from $1,467 per ML to $1,443 per ML. NSW Gwydir GS and NSW Lachlan HS recorded their second year in a row of no priced trades – the last priced trade was in October 2020.

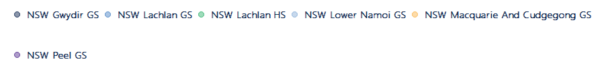
Figure 19. Individual water entitlement trades (priced trades only, $0 trades excluded) and volumes (bubble size) for active northern Murray-Darling Basin entitlement markets, 2012-13 to 2021-22.
Source: Aither, 2022. Based on New South Wales Water Register, 2022.
Note: Data based on 71Q licence-to-licence transfers, which tend to be unrelated to land transfers. No priced trades were recorded on the NSW Water Register for NSW Gwydir GS or NSW Lachlan HS in 2021-22. See Figure Notes.
5.1 The year in water policy and management
A change in the Australian Government in mid-2022 generated significant interest as market participants were curious to know if any water policies would be altered. As a key election promise, the new water minister, Tanya Plibersek, affirmed the government’s commitment to the complete delivery of the Basin Plan.
The Government made an election commitment to “Future Proof Australia’s Water Resources”, which included a 5-point plan for the Murray-Darling Basin (MDB) promising to:
- Work with Basin state governments and stakeholders to deliver on water commitments, including the 450 GL of water for the environment.
- Increase compliance across the Basin and to support compliance work and improve metering and monitoring.
- Restore integrity and confidence by working with stakeholders to implement relevant ACCC recommendations, and by making the MDBA’s modelling and data publicly available where possible.
- Increase First Nations ownership of water entitlements and participation in decision-making.
- Future-proof the Basin Plan by updating the science.
Of these policies, the Basin Plan implementation and recovery of water for the environment remains the most uncertain and contested.
Apart from the Basin Plan, the Water Market Reform Final Roadmap was released in November 2022 by the Department of Climate Change, Energy, Environment and Water (DCCEEW) in response to the ACCC’s MDB Water Markets Inquiry. Several reviews also began, including the Productivity Commission’s statutory review of MDB Plan Implementation (due Dec. 19, 2023) and the Murray-Darling Basin Authority’s Basin Plan Review (due 2026).
Water recovery and delivering the Basin Plan on time.
As of 30 June 2024, the Basin Plan will expire, but several recovery targets remain incomplete, including the 605 GL Sustainable Diversion Limits Adjustment Mechanism (SDLAM) (supply measures) and 450 GL SDLAM (efficiency measures) water for the environment.
In its 2022 SDLAM Assurance Report, the MDBA outlined an estimated shortfall of between 190 GL to 315 GL of the 605 GL target and only 26 GL (DCCEEW, 2023) of progress has been made towards the 450 GL target.
The 2023-24 Budget contained no announcements on how the Government will deliver these targets, however, Minister Plibersek made it clear that entitlement purchases have not been ruled out.
In February 2023, the Minister announced an entitlement purchase program for the remaining 49.2 GL Bridging the Gap local targets, mainly in the northern Basin.
Given the short timeframe to deliver on the Basin Plan, there are significant hurdles that remain for the Government to overcome, including getting Basin states and the Commonwealth aligned and executing potential legislative and policy changes.
Remaining water from recovery targets as of June 2023 include:
- 2 GL Bridging the gap local targets
- 190-315 GL SDLAM (supply measures) (605 GL)
- 424 GL SDLAM (efficiency measures) (450 GL)
| Implication for water market participants: Water market participants are uncertain if the government will purchase water entitlements on a large scale to meet the Basin Plan deadline of June 30, 2024. Any such buyback would likely have significant implications for entitlement markets and, once complete, could reduce the consumptive pool and affect allocation markets, especially during drought periods. |
The Water Reform Roadmap paves a way forward following the ACCC’s water markets inquiry.
In October 2022, the Water Reform Final Roadmap was released. The Roadmap, developed by Principal Advisor Darryl Quinlivan AO, outlined 23recommendations as the government’s response to the ACCC’s water markets inquiry final report. In the first Ministerial Council meeting since November 2020, Minister Plibersek gained in principle agreement from Basin State Ministers on the implementation of the roadmap.
The Roadmap outlines an implementation plan for water policy reform. It aims to enhance confidence in water markets, establish new integrity standards, and enable investment in new data and system capabilities to improve trade and transaction transparency. It also highlights the importance of Commonwealth and State co‑operation to achieve the outcomes, given their shared regulatory and operational responsibilities.
The Roadmap has identified four crucial areas of reform.
- Integrity and transparency.
- Data and systems.
- Market architecture.
- Governance
The Australian Competition and Consumer Commission (ACCC) was appointed as the regulator for water market integrity and conduct reform in October 2022. This includes enforcing new Basin-wide laws and a mandatory code of conduct for intermediaries. However, the reforms require time to implement, and multiple systems and capabilities need to be developed.
| Implication for water market participants: Improvements in the four key reforms areas and the introduction of the ACCC as the market regulator will build upon previous water reforms across the MDB and should result in improved market trust, information and transparency. However, implementation is likely to take several years. |
Progress on market information, transparency, and data tools.
Accurate and timely water information is essential for making trading decisions and boosting market confidence. The Basin States and other government agencies are working to improve the quality and accessibility of water market information to meet the ACCC inquiry’s recommendations.
- The BoM released their Murray-Darling Basin Water Information Portal to provide centralised information on storages, allocations and trading information on Basin catchments and received funding of $32.7 million for the creation of a Water Markets Data Hub.
- Victoria amended their legislation to improve water market transparency and strengthen deterrents to water theft.
- South Australia released their Final Water Security Statement. It has also scoped a number of regulatory and operational business improvements to their Water Register. These enhancements were expected to be rolled out in 2022-23, but have been delayed, and it is unclear when this will be delivered.
- NSW released their first 20-year water strategy for all of NSW, including an integrated and transparent reporting framework. NSW also continued to update and improve their Water Insights portal.
- The Productivity Commission released its Terms of Reference for their review of the Murray‑Darling Basin Plan Implementation Inquiry, to be delivered to the Government by 19 December 2023.
- The MDBA announced they are preparing for the 2026 Basin Plan Review and released their Roadmap to the 2026 Basin Plan Review.

Figure 20. Timeline of Murray-Darling Basin water policy events 2022-23.
Source: Aither, 2023.
5.2 Summary of key water policy events
October 2022-23 “mini” Budget
The Albanese Government’s first Budget was delivered in October 2022-23. The Government announced two unspecified funding amounts under the measures for the Murray Darling Basin, which is potentially funding for the 49.2 GL Bridging the Gap buybacks announced by Minister Plibersek in February 2023.

2023-24 Federal Budget
The Commonwealth Government announced funding allocations for water on May 9, 2023. Many of these allocations were in line with election promises.
While $1 billion of funding from the $4.5 billion Hells Gates Dam cancellation was returned to the NWGF for future projects, the $872.5 million in savings from the 2023-2024 Budget was returned to the bottom line as a Budget saving.

| Implication for water market participants: Funding allocations and initiatives will help to improve water transparency and integrity in water markets and deliver other outcomes. The cancelled dams may have implications for the irrigation sector and further development in the regions. |
National Water Commission
During the 2022 election, the Government committed $26 million to establish the National Water Commission, which was abolished under the Abbott Government in 2014. This was aimed at driving ongoing reform and providing a platform for national water leadership and driving the renewal of the National Water Initiative. DCCEEW has been tasked with undertaking initial scoping work to determine the Commission’s roles and responsibilities as a first step.
Victorian Place of Take Reforms
As deliverability risk becomes an increasingly pressing issue in the Lower Murray, the Victorian Government is adopting a new method of water delivery management in declared systems which will come into effect by 1 July 2024. Changes under the Water Legislation Amendment Bill 2023 provide for the unbundling of take and use approvals from works approvals, enabling the permanent transfer of these rights between water users. The amendments are intended to provide flexibility for water users to manage their own delivery risks.
The Place of Take framework seeks to clarify water delivery entitlements and protect the use of water during a river rationing event, allowing the Minister for Water to make rules to cap delivery entitlements where delivery risks are increasing, and to ration take.
The changes will apply to declared systems across Victoria, including the regulated Murray, Goulburn, Campaspe, Loddon, Broken, Bullarook, Ovens, Werribee, and Thomson-Macalister systems. However, to date most Victorian rivers have not required rationing, except the Murray below the Barmah Choke.
Under the new framework 5 rationing areas have been proposed on the Murray system below the Barmah Choke, which will be rationed together;
- Barmah to Nyah
- Nyah to Euston Weir
- Euston Weir to Mildura Weir
- Mildura Meir to Lock 7
- Lock 7 to SA Border
Everyone who has a right to take water out of the given Victorian systems will be issued a Place of Take approval, and existing rights to take water for use on land will be maintained. Approvals will be issued for each service point from which water is taken. The framework will allow for the trade of extraction shares which may be rationed in the event of delivery shortfalls.
| Implication for water market participants: Waters users who own rights to take water in Victorian systems will be issued a Place of Take approval, which will regulate the amount of water taken in the event of a river rationing event declared by the Minister for Water. Market participants will need to ensure their extraction share is sufficient to manage their risks if delivery was rationed, which is mainly a risk in the lower Murray. |
Draft Water Amendment Bill 2023
The DCCEW have conducted consultations and feedback for the draft Water Market Reform Bill which is planned to be introduced to Government in late 2023, and makes changes in line with the 23 recommendations in the Water Market Reform Roadmap.
They have identified 6 key areas of reform within the legislative changes bill, including:
- Water market intermediaries code
- Proposed mandatory code to be developed in regulations and enforced by the ACCC.
- Insider trading prohibitions
- Strengthened insider trading prohibitions.
- Data and systems reforms
- New data reporting obligations, including a framework for developing a Water Markets Data Standard.
- Water markets announcements
- Certain decisions by state and Commonwealth governments, agencies and IIO’s (public and private) must be announced in a specified manner.
- Market manipulation prohibitions
- New prohibitions on all water market participants against market manipulation.
- Removal of grandfathered tags
The proposed reforms to the Commonwealth Water Act will see the ACCC appointed as the market regulator, data systems and information will be overseen by the IGWC and BoM. The amendments also facilitate the removal of grandfathered tags.
The aim of the reforms is to strengthen transparency, integrity and confidence in MDB water markets. The reforms will come into effect after the legislation has passed through Government and is implemented by the department. This will require further stakeholder consultation, therefore it will be some time before the reforms are fully implemented.
Irrigators’ Share from GMW Connections Project Stage 2
On-ground works for the Goulburn-Murray Water (GMW) Connections Project – the largest irrigation modernisation project in Australian history – were completed in October 2020. This project created 429 GL of water savings, of which 77 GL were distributed amongst delivery share owners in the Goulburn Murray Irrigation District (GMID).
GMW and DEECA are preparing to close out the ISD project, and as of April 2023 approximately 50 individuals are yet to receive a benefit from the original 77 GL irrigators share.
Eligible recipients have a deadline of 1 May 2024 to complete the paperwork to claim their benefits, any unclaimed benefits by 30 June 2024 will be surrendered to the consumptive pool, and financial benefits transferred to the State Revenue Office.
| Implication for water market participants: Eligible recipients who have not claimed their benefits must do so by 1 May 2024, or risk forfeiting these back to the consumptive pool and/or state government. |
Roadmap for the Basin Plan review 2026
On 14-15 June 2023, the Murray Darling Basin Authority held its third annual River Reflections conference in Narrabri, the Chair of the MDBA, Sir Angus Houston AK, AFC, to discuss water management, knowledge sharing, and water reform.
Here the MDBA formally announced their Roadmap to the Basin Plan Review 2026, which will map out the work needed to be done for the sustainable management of water resources in the Basin over the next decade.
The MDBA will be conducting stakeholder consultations and making 6 monthly updates on the progress of the Review.
Murray-Darling Healthy Rivers Grant Program and the Urban Rivers and Catchments Program.
The Healthy Rivers program is part of the 2020 Murray-Darling Communities Investment Package. In 2022, the Australian Government announced an update to this package. This included a new $97 million Healthy Rivers – Healthy Communities grant program, which builds on the Healthy Rivers grant program and will run until 2023-24.
In the October 2022-23 Budget the Government provided $91.1 million over 6 years for the first round of the Urban Rivers and Catchments program. For Round two of the program, the Government provided an additional $118.5 million over 6 years in the 2023-24 Budget. The programs aim to improve waterways and water quality, restore habitats and biodiversity, and create recreational green spaces in communities. The projects are to be delivered by local government, water utilities and non-government organisation with funding provided via the states.
| Implication for water market participants: These grant programs demonstrate the positive impact that local communities can have on their stretch of river. The programs have funded projects aimed at improving the health and quality of rivers and wetlands, as well as community engagement in waterway well-being. |
6.1 Climate and rainfall outlook
Drier conditions forecast for 2023-24.
After an extended La Niña drove wet conditions for three consecutive years, rainfall outlooks for 2023-24 indicate drier conditions are expected throughout the MDB.
With 2023-24 now underway, conditions have been drier than average for this time of the year (Figure 21). The current three-month rainfall outlook indicates that there is only at least a 20% chance of rainfall exceeding the median across the majority of the MDB (Figure 22).
Bureau of Meteorology (BoM) models also suggest a 70% chance of an El Niño event forming around winter-spring in 2023. El Niño typically suppresses winter–spring rainfall in eastern Australia.
BoM models also indicate that it is likely that a positive IOD will develop in the coming months. The combination of a positive IOD and El Niño events usually have the effect of below average rainfall for most of southern Australia.

Figure 21. One-month rainfall deciles, Murray-Darling Basin, July 2022 (issued 31 July 2023).
Source: Aither, 2023. Based on Bureau of Meteorology, 2023.

Figure 22. Three-month rainfall outlook (issued 13 July 2023).
Source: Aither, 2023. Based on Bureau of Meteorology, 2023.
6.2 Allocation market outlook
High opening allocations for 2023-24, despite a dry climate outlook.
Full storages and persistent rainfall led to most entitlements in the southern MDB matching or improving on their 2022‑23 opening allocations.
- Vic Goulburn HRWS and SA Murray HS opened at 100%. This marked the third consecutive year of full opening allocations in SA Murray HS entitlements, and the first on record in Vic Goulburn HRWS.
- Only Vic Murray HRWS saw a reduction in the opening allocation, down from 94% last year to 80% – the second highest on record.
This means that opening water availability increased from 2022-23, with an estimated 3,450 GL of water available on 1 July 2023 (2022-23: estimated 3,200 GL).
Carryover volumes on 1 July were also greater than 2022‑23, with Aither’s estimates showing approximately 2,200 GL of water was carried over into the new water year (up 14%). However, with Victorian storages at capacity much of this volume is likely to spill.
For the second consecutive year, water available on major southern MDB entitlements is over 5,000 GL.

Figure 23. Opening allocations made to major southern Murray-Darling Basin entitlements, 2020-21, 2021-22, 2022-23 and 2023-24.
Source: Aither, 2023. New South Wales Department of Planning, Industry and Environment, 2023; Northern Victoria Resource Manager, 2023; South Australian Department for Environment and Water, 2023.
Note: In-text estimates of the volume of water allocated and carryover volumes include zones Vic 1A Greater Goulburn, Vic 6 Murray, Vic 7 Murray, NSW Murray, and NSW Murrumbidgee. See Notes and Figure Notes sections.
Maximum allocations likely before peak irrigation in most zones.
In early 2023-24, allocations prices in the lower Murray are around $90, $110 in the Murrumbidgee, $50 in the Goulburn, and $82 in the upper Murray.
High early season allocations in conjunction with record levels of carryover mean irrigators have great confidence in water availability for the season ahead. If at least average flows eventuate, consumptive water availability could reach around 6,630 GL by the start of the peak irrigation season (Table 7).
This year’s forecast exceeds last year’s available volume (about 6,540 GL) by early-December. This is due to higher carryover volumes into 2023-24 (2,200 GL) compared to last year (1,925 GL). However, full storages means there is a high risk of spill and much of this volume could be spilt. Improvements to NSW Murrumbidgee GS allocations will require early-season water use to create airspace in dams.
Aither’s view is that there are two likely possibilities for allocation prices over the next 12 months, noting the BOM’s current climatic outlook at the time of writing (July 2023). Moderate water use combined with a neutral climatic outlook for 2024-25 is likely to see average prices between $50 – $120 per ML, trending towards $0 at the end of the season. High water use combined with a dry climatic outlook for 2024-25 would likely see prices between $70‑$150 per ML, trending towards $200 at the end of the season.
Table 7. Peak irrigation season outlooks for 2022-23 based on inflow scenarios (as of 17 July 2023).
| | Wet - See note | Average - 50 per cent change of exceeding | Dry - 90 per cent change of exceeding | Extreme Dry - 90 per cent change of exceeding | Est. of consumptive water available (GL) - Average inflows |
|---|---|---|---|---|---|
| Vic 1A Goulburn HRWS | 100% | 100% | 100% | 100% | 677 |
| Vic 6 Murray HRWS | 100% | 100% | 100% | 91% | 209 |
| Vic 7 Murray HRWS | 100% | 100% | 100% | 91% | 672 |
| NSW Murray 10 HS | 100% | 100% | 100% | 100% | 18 |
| NSW Murray 10 GS | 110% | 110% | 110% | 110% | 1,030 |
| NSW Murray 11 HS | 100% | 100% | 100% | 100% | 146 |
| NSW Murray 11 GS | 110% | 110% | 110% | 110% | 278 |
| NSW Murrumbidgee HS | 95% | 95% | 95% | 95% | 335 |
| NSW Murrumbidgee GS | 50% | 47% | 40% | 37% | 644 |
| SA Murray HS | 100% | 100% | 100% | 100% | 401 |
| Total | | | | | 4,430 |
| Total including estimate of carryover | | | | | 6,630 |
Note: There is some variation in the scenarios released by the state governments. The wet outlook is shown for NSW entitlements (25% chance of exceeding), and the above-average outlook is shown for Victorian entitlements (30% chance of exceeding).
Note: Outlook months used to estimate the volume of water allocated by peak irrigation season are 1 November for NSW entitlements and 15 December for Victorian entitlements as published in the respective allocation statements released on 17 July 2023.
6.3 Entitlement market outlook
Our outlook for entitlement markets is highly uncertain. Whilst entitlement prices experienced some appreciation over the last 12 months, economic headwinds and waning demand saw values soften towards the end of 2022-23. There is a possibility of further decline over 2023-24 due to the lag effects of interest rate rises and poor commodity prices for some sectors. Returns on leases also remain low due to low allocation prices.
The Commonwealth Government’s efforts to meet Basin Plan recovery targets may result in a significant buyback program, which could temporarily raise entitlement prices. According to recent statements made by Minister Plibersek, the government is planning to extend the deadline of 30th June 2024 in response to an assessment by MDBA that suggests complete implementation of the Basin Plan by that date may not be feasible. This could have an impact on the government’s decision-making process concerning buybacks in the near future. Nevertheless, it’s likely that the positive long-term macroeconomic factors have already factored in much of the potential gains for entitlement prices.
Meanwhile, short-term economic headwinds including higher interest rates and supply chain costs continue to place downward pressure on entitlement prices.
High reliability and high security entitlement markets.
This time last year, low interest rates and concerns about long-term water scarcity continued to fuel price rises for several high security (HS) and high reliability water shares (HRWS). This was further aided by the limited supply of these entitlements in the market.
Whilst entitlement prices in the southern MDB continued to increase over 2022-23, the final quarter of the year saw the beginning of a change in entitlement markets. Following nine consecutive months of interest rate rises, continuing wet conditions and reduced returns, demand began to soften as buyers vacated the market. Simultaneously, sellers were also holding, awaiting further information on a potential Commonwealth buyback. Consequently, active sellers were forced to take offers from opportunistic buyers, and prices started to fall.
While HS and HRWS prices may face downward pressure in this environment, the possibility of a federal government water entitlement buyback may have some countervailing influence on this until there is clarity on Basin Plan delivery.
As it currently stands there remains potential for a Government buyback of some significance. If this were to occur it would place upwards pressure on entitlement prices in the short term, potentially followed by a correction when the Government exits the market. Ultimately, the major long-term driver of HS and HRWS entitlement prices remains limited supply and the growth in high-value perennial horticulture. However, entitlement prices need to be supported by economic realities.
Low reliability and general security entitlement markets.
At the time of writing (mid-July 2023), continuing demand for secure carryover space remains the key driver for LRWS prices. However, whilst values rose sharply through 2022-23, future price movements are more uncertain.
Access to carryover space remains an important risk management tool for many market participants. Limited carryover space in the lower Murray and greater regulatory certainty from the Goulburn to Murray trade rule are likely to influence prices for Vic 1A Greater Goulburn LRWS and Vic 6 Murray LRWS. A key factor to monitor in 2023-24 is the volume of spill in the Murray and the Goulburn. A second year in a row of allocations to Murray and Goulburn LRWS entitlements may influence market perceptions on how they should be valued.
Demand for GS entitlements is usually cyclical, with prices increasing during wet periods when these entitlements receive higher allocations. At the time of writing NSW Murray GS has received full (110%) allocation, this may influence demand in the short term – despite a drier climatic outlook.
Allocation outlooks for NSW Murrumbidgee GS are less promising than NSW Murray GS, with maximum allocations less likely before peak irrigation season. A key driver that could influence this is annual crop commitments for 2023-24. Dry forecast conditions and high water availability may influence demand for GS entitlements in the Murrumbidgee.
6.4 Policy and regulatory influences
Delivering on the Basin Plan by 30 June 2024.
Looking ahead to the 2023-24 water year, the federal government’s key focus will be on delivering the Basin Plan, with Minister Plibersek recently confirmed the Basin Plan can’t be delivered on time, the Government’s focus now appears to be a deadline extension.
The MDBA Chair, Sir Angus Houston, was quoted as saying “Implementation of the Basin Plan is at a critical juncture. It is important that the challenges inhibiting the full delivery of the Basin Plan are quickly addressed to provide a clear pathway forward”.
Minister Plibersek reaffirmed the Government’s commitment to full delivery of the Basin Plan, including recovery of the 450GL (SDLAM efficiency measures) saying “We’re talking about some extensions with an increased expectation of delivery. It’s not an option to not deliver the plan”.
The key deliverables remaining in the Basin Plan are the expected 190-350 GL SDLAM (supply measures) shortfall, and the remaining 424 GL from the 450 GL SDLAM (efficiency measures) target. Minister Plibersek has made it clear that buybacks are not off the table, after the early 2023 open tender for the remaining 49.2 GL of the Bridging the Gap target. If the Government enters the open market for entitlement purchases, it will likely see an appreciation of entitlement prices over the short to medium term (depending on the timing and scale of any program(s), and which entitlement types are targeted across the Basin).
In order to open a new tender for additional entitlement purchases and / or extend the deadline for the Basin Plan, the Minister will be required to make legislative changes to the Water Act (2007). Under the current legislation, there remains 271.6 GL of the cap on entitlement purchases.
The August Ministerial Council may provide additional insights into how the Government will work with Basin States to deliver the Plan, and what legislative changes they will be seeking before the 30 June 2024 deadline.
Key developments to watch in 2023-24.
- The MDBA has provided advice to Minister Plibersek that full implementation of the Basin Plan and its intended outcomes will not be possible by 30 June 2024. While the Minster has foreshadowed a time extension, legislative changes are required to extend the Basin Plan beyond the deadline.
- Outcomes from the August 2023 Ministerial Council, with expectations of Minister Plibersek addressing how the Commonwealth will deliver on Basin Plan, and the possibility of extending the deadline.
- Development on the MDBA’s 2026 Basin Plan Review, including opening of stakeholder engagement consultations.
- Release of the Productivity Commissions Basin Plan Implementation inquiry, to be delivered to the Government by 19 December 2023.
- Developments in the BoM’s Water Market Data Hub and Water Information Portal, to improve data information sharing and market transparency.
- How the Government plans to spend the remaining money in the National Water Grid Fund, with the announcement of cancellations of a number of large dam projects across regional Australia in the October 2022-23 and March 2023-24 Budgets.
- The MDBA’s stakeholder consultation on the Roadmap to the Basin Plan Review 2026, which will map out the next decade of management in the Basin.
- DCCEEW’s consultations for the exposure draft on Water Amendments (Water Market Reform) Bill 2023, which is aimed at legislative amendments to enable the recommendations made in the Water Markets Reform Roadmap and are planning to introduce to Parliament in late 2023.
References
ABARES (2023), Australian Crop Report: June 2023, Australian Bureau of Agricultural and Resource Economics and Sciences, Canberra, DOI: CC BY 4.0. Available at <https://doi.org/10.25814/4xkx-8v26 >.
Aither (2023) Water supply and demand in the southern Murray-Darling Basin (2022 update): An assessment of future water availability and permanent horticulture irrigation water demand. Available at <https://www.waterregister.vic.gov.au/about/news/411-water-supply-and-horticulture-demand-in-the-southern-basin-2022-update>
MDBA (Murray-Darling Basin Authority) (2023). End of day Barmah Choke transactions data. Available at <https://www.mdba.gov.au/managing-water/water-markets-trade/interstate-water-trade/barmah-choke-trade-balance>
Murray Irrigation Limited (2023). Daily sales data. Available at (current water year only) < https://www.murrayirrigation.com.au/live-daily-sales> [Accessed 28/6/2023]
Northern Victoria Resource Manager (NVRM) (2023). Outlook for the 2023/24 season. Available at <https://nvrm.net.au/outlooks/current-outlook > [Accessed 17/07/2023].
WaterNSW (2023). Regional NSW Dam Levels. Available at https://www.waternsw.com.au/nsw-dams/nsw-storage-levels/regional-nsw-dam-levels [Accessed 10 July 2023].
Victorian Water Register (2023). Trade opportunities each year between zones. Available at < https://www.waterregister.vic.gov.au/water-trading/market-insights/trade-opportunities>
About Australia’s Water Markets
Background
In Australia, there are two distinct but related water markets: entitlement markets and allocation markets.
Entitlement markets enable the trading of water entitlements. Water entitlements are ongoing rights to receive an annual share of available water resources in a consumptive pool (e.g., a river system or catchment). They are analogous to a land property right, are generally secure and mortgageable in the same way, and have substantial value. Each catchment typically has a small number of entitlement ‘classes’, and generally all entitlements within a given class are homogenous.
Allocation markets enable the buying and selling of water allocations. Water allocations are the volumes of water allocated to water entitlement holders during the water year (1 July to 30 June). They are a physical good analogous to a commodity, and are extracted from water courses and applied as inputs to production or the environment. Based on the water availability and demand at a given time, the value of water allocations per unit varies (usually expressed in $ per megalitre (ML)).
There is no single national Australian water market. Rather, there are many individual markets determined by the hydrological characteristics of physical water systems. Where hydrological connectivity exists, such as in the southern Murray-Darling Basin, trade between markets or zones is possible.
ENTITLEMENT MARKETS
Purpose, use and operation
An entitlement specifies an annual volumetric share of available water resources in a specified catchment or system. Entitlement holders receive their share of the available water resources as water allocations. Allocations vary from year-to-year based on rainfall, inflows, water held in storage and other factors. The entitlement market enables trade in the ongoing right to receive these water allocations. Entitlements can be held by virtually any party in any location.
The entitlement market is largely used by irrigated agricultural producers, but is increasingly being used by investors, water utilities (including urban suppliers) and environmental water holders. These water market participants use the market to modify their long-term arrangements for facilitating production, or meeting environmental requirements, or urban demand.
State government agencies govern the operation of entitlement markets, including rules and regulations regarding how and where trade can occur. Depending on the jurisdiction, other agencies (such as land titles or property registration agencies) will be involved. Third parties (such as exchanges, brokers and conveyancers) often play a role in facilitating entitlement trade.
Key drivers of market outcomes
The value of water entitlements is largely determined by their reliability characteristics. Reliability characteristics differ across entitlement classes. Higher reliability entitlements provide larger volumes of water allocations over the long term, and more consistently provide water allocations each year than lower reliability entitlements.
Trade in entitlements is related to longer-term production decisions and the characteristics of different irrigated agricultural enterprises, including their tolerance for risk. Producers who may be expanding or contracting production drive market activity, as do market participants who hold large portfolios of entitlements such as investors or large agricultural enterprises. Purchases of water on behalf of the environment have also driven market activity in the past.
ALLOCATION MARKET
Purpose, use and operation
The allocation market provides the ability to trade physical water between parties for use, further trade, or carryover. Allocation trade can generally only occur between parties who are in trading zones that are hydrologically connected such that water can be delivered (or substituted by other water from a shared storage).
The water allocation market is mainly used by irrigated agricultural producers (including rice, dairy, horticulture, cotton and others), and environmental water managers. Irrigators use the market to sell water excess to requirements, or buy additional water for use during dry periods or when temporarily expanding production. Environmental water holders may similarly buy or sell when they have short-term surpluses or deficits.
Similar to entitlement markets, state government regulators determine annual allocations based on entitlement characteristics (that determine priority and how much water is allocated to individuals), and market rules to manage issues such as connectivity between systems and transmission losses. State governments, either directly or via their water utilities, play a key role in facilitating allocation trade, including ensuring compliance with rules and regulations, and by approving and processing trades. Parties seeking to trade allocations may utilise intermediaries such as water exchanges and brokers.
Key drivers of market outcomes
The volume of water allocated to entitlement holders each year is a key driver of allocation market outcomes (including prices and volumes traded) because it strongly influences the total volume of water available for use or trade. When allocations are low, water is scarce and prices are high. The opposite is true when allocations are high. Allocation levels reflect broader water availability, including rainfall and inflows in relevant catchments, and volumes held in storages. Other key drivers in allocation markets include conditions in markets for irrigated agricultural products, and conditions in substitute input markets.
Download Water Markets Report Notes
State water register trade data and volume weighted average prices
Data cleaning method
Irrigation corporation trade data
Carryover estimates
Entitlement on issue data
Rounding errors
Aither Entitlement Index
Table notes
Figure notes