Background
Australian water management has undergone a significant period of reform over the past three decades. The establishment of water markets has been a key component of this reform story.
Water markets are now an established part of agricultural, urban and environmental water policy, management and investment in Australia.
The Aither Water Markets Report provides an overview of current water market activity in the southern Murray–Darling Basin, compares market outcomes with recent years and comments on the future outlook.
Download the PDF here

About Aither
Our Water Market Services
We are a team of award-winning, independent water markets, policy, and infrastructure advisors.
Every day, we help businesses and governments make better decisions about scarce water resources.
We do this by providing high-quality information, insights and analysis that help our clients design and implement strategies for successfully participating in Australia’s water markets. Our team also provides policy, regulatory and infrastructure advisory services.
Whether you need custom-designed water strategies or assessments of your exposure to water-related risks and opportunities, we’ll help you make clear, informed and confident water decisions.
Executive Summary
Facts at a glance – 2021-22
- Estimated value of commercial allocation trade in major southern MDB trading zones: $94 million.
- Annual average southern MDB allocation prices: $54 per ML in Vic 1A Greater Goulburn to $104 per ML in SA Murray.
- Estimated value of major southern MDB entitlements on issue (including environmental and Victorian water corporation holdings): $30 billion.
- Aither Entitlement Index (AEI) 30 June 2021: 299 points (up 18% over 12 months).
- Value of total entitlement transfers: $812 million.
- Total volume of entitlement transfers or trades (outside of irrigation corporations): 213 GL (down 11% on 2020-21).
- Entitlement market turnover: 4%.
- Average annual high security and high reliability entitlement returns (sale of allocations): between 0.7% and 1.4%.
Summary of 2021-22
Widespread rainfall across the southern Murray-Darling Basin (MDB) created some of the best water availability conditions seen over the last three decades. These conditions kept water allocation prices low, and meant that 2021-22 was a rare year when water was not at the top of the list of concerns for irrigation businesses.
Allocation markets
- Although large areas of annual crops were planted in 2021-22, the wet conditions meant that many irrigators did not need to fully draw on the water in their accounts, nor purchase as much allocation on the market. When high supply and low demand combine with limited capacity for private carryover, it creates a ‘double whammy’ effect, and allocation prices tend to fall very quickly.
- The annual volume weighted average price for allocations across the southern Murray-Darling Basin was $71 per ML. However, late in the season, allocation prices got close to $0 in some systems, due to limited private carryover space and market expectations for low allocation prices in 2021-22.
- Limited opportunities for downstream trade meant that allocation prices were higher in the lower Murray than in the upstream zones for most of the year.
Entitlement markets
- Prices for high reliability and high security entitlements increased markedly in 2021-22. These increases reflect continued long-term interest in water entitlements and a lack of willing sellers.
- The Aither Entitlement Index closed the year at an all-time high, up 18% on the last water year. The price increases for most major entitlements drove month-on-month increases in the Aither Entitlement Index across the year (except between March and April 2022).
- Long-term demand for carryover space meant low reliability entitlement prices increased for the second year in a row. As is often the case during a wet cycle, general security entitlement prices also increased for the second year in a row.
Facts at a glance – Outlook
- Comparison of 2021-22 and 2022-23 opening season allocations to consumptive users (excluding carryover): 1,400 GL more water allocated at opening of 2022-23.
- Estimated 2022-23 total volume of water available to southern MDB consumptive users before peak irrigation season under average inflows scenario (including carryover): approximately 6,360 GL.
- Bureau of Meteorology three-month rainfall outlook (August to October) for southern MDB: Above average.
- Current (early August 2022) southern MDB allocation prices: $50 to $85 per ML.
Outlook for 2022-23
At the start of 2022-23, strong new season allocations to most entitlements, and a record volume of consumptive carryover water, means irrigators have a lot of certainty for the year ahead. The major dams in the southern MDB are also very full. This means that many irrigators are looking forward with confidence to another year (and perhaps two years) of low water allocation prices.
Allocation markets
- With high early season water availability, many water users can afford to be patient. If the current wet outlook eventuates (early August 2022), by peak irrigation season over summer, almost all entitlements will have been fully allocated. If this happens, and we get another wet summer, allocation prices could stay low. If we get a more typical summer, allocation prices could hold steady or increase modestly from current levels, before decreasing towards the end of the year.
- Downstream trade opportunities are likely to be few and far between. This means prices in the lower Murray will again be higher than the upstream zones.
- Water demand from annual croppers in the Murrumbidgee will be key. If it turns dry over summer, allocation prices could be pushed higher than in the lower Murray and we could possibly see back trade into the Murrumbidgee.
- With full storages in the southern MDB, the outlook for 2023-24 looks positive. Beyond that, it depends on the weather.
Entitlement markets
- The long-term outlook for entitlement markets still appears positive. Commodity prices, for some irrigated agricultural industries are strong (e.g., cotton and rice). However, questions are being raised about the extent to which entitlement prices can continue to increase given the current low yields, alongside increasing interest rates.
- While market participants are considering whether the Federal Government will recommence water entitlement buybacks, the major driver of high security and high reliability entitlement prices is likely to be the volume of uncovered permanent horticultural demand.
- Access to carryover space will remain an important part of many market participants’ water strategies. Given that carryover space in the lower Murray is so scarce, this demand will continue to influence prices for low reliability entitlements in the upstream zones.
- 2022-23 is likely to be a strong year for NSW general security entitlement values given high allocations and comparative value to high security and high reliability entitlements.
1.1 Introduction
Now in its ninth year, the Aither Water Markets Report provides water market participants, advisors, investors, and policy professionals with an annual snapshot of recent water market drivers and activity in the southern connected Murray-Darling Basin (MDB) (Figure1).
This year’s report highlights the key drivers of the low water allocation prices observed in 2021-22 compared to the last three years, including:
- the fact that a wet cycle has returned, driven by a combination of a La Niña event and negative Indian Ocean Dipole
- compounding factors across the southern connected system created the best water availability conditions in the last 15 years
- consistent in-crop rainfall throughout the year which suppressed buying demand for water allocations.
We also highlight the large increases in high reliability and high security entitlement prices following a period of stabilisation in 2020-21. These increases were driven by favourable economic conditions that strengthened the Australian agricultural sector. It also suggests that market confidence has returned following the release of the ACCC’s final report from its water markets inquiry in early 2021, and the uncertainty initially caused by the COVID-19 pandemic.
As we look ahead from August 2022 (the time of writing), our outlook for 2022-23 explores how these factors may influence water markets in the southern MDB over the next 12 months.

Figure 1. Water trading zones in the southern Murray-Darling Basin.
Source: Aither, 2022.
Note: For the purposes of this report, Aither has defined the southern MDB as comprising of the Vic Goulburn, Vic Murray, NSW Murray, NSW Murrumbidgee, and SA Murray.
Aither Entitlement Index
As the only index of its kind in Australia, the Aither Entitlement Index (AEI) provides a simple, consistent, and reliable snapshot of water entitlement performance throughout the southern MDB.
Across the 2021-22 water year, the AEI increased by 18%, compared to 6% in each of the last two water years (2020-21 and 2019-20). Strong growth in the AEI was evident throughout most of the year. The largest monthly increase was 5%, between October and November. Growth slowed slightly in March 2022 and decreased marginally in April 2022 (down 0.2%), before picking up again at the end of the water year (Figure 2).
The Aither Entitlement Index tracks the performance (capital value) of a group of major water entitlements across the southern MDB.
The AEI is currently at an all-time high. The Compound Annual Growth Rate (CAGR) of the AEI is 8% since its inception in 2008-09. Since 2015-16, when entitlement prices began to rapidly appreciate, the CAGR is 17%.
Aither’s independent water market specialists update the AEI every month using our in-house southern Murray-Darling Basin water asset valuations. The AEI supports better decision making by providing irrigators, investors, banks and other water owners with a reliable benchmark to track the capital value performance of water portfolios and investments, and attract new investors.

Figure 2. Aither Entitlement Index, 2008-09 to 2021-22.
Source: Aither, 2022.
2.1 Climatic Conditions
Widespread and persistent wet conditions across the entire MDB.
2021-22 saw a continuation of the wet conditions that started in early 2020. Above average rainfall persisted throughout the year across most of the MDB (Figure 3).
Across the water year, in 8 out of 12 months, most of the MDB received average to above average rainfall. The exceptions were August, December, February, and June.
Wet conditions across the MDB were driven by a negative Indian Ocean Dipole (IOD) in winter-spring, and a La Niña event from late spring until the end of the water year.
The Bureau of Meteorology declared a negative IOD in July 2021, which persisted until November 2021. This brought above average rain to south-east Australia in the early months of the water year. During November, the negative IOD weakened, but a La Niña event in the Pacific Ocean quickly followed. While the 2021-22 La Niña was a relatively moderate event, it persisted until the end of 2021-22 and continued to bring wet weather.
Compared to 2020-21, when rainfall varied across the headwater catchments in the southern connected system, this year all headwater catchments benefited from above-average rainfall.
It was also very wet in the northern Basin, with above average to very much above average rainfall. At the end of the water year, all major NSW rural storages were near full, except Windemere and Split Rock dams (NSW Department of Planning and Environment, 2022a).

Figure 3. Rainfall deciles for the Murray-Darling Basin, 1 July 2021 to 30 June 2022.
Source: Aither 2022. Based on Bureau of Meteorology, 2022.
2.2 Storages
Strong and consistent inflows kept southern MDB storages topped up throughout the year.
Consistent rainfall and inflows throughout 2021-22 meant southern connected MDB storages were recharged in the winter-spring and remained topped up for most of the year. At the end of the water year, there was 11,527 GL in the storages. This is the largest end of year volume since 2011-12, when it was 11,550 GL at 30 June 2021.
The volume of water held in southern MDB storages peaked at 11,718 GL in late December 2021. This is later than previous years when the peak volume typically occurs between early September and late November (since 2011-12) (Figure 4).
The wet summer meant the drawdown was low at only 673 GL (outflows exceed inflows). This is the smallest irrigation season drawdown since the Millennium Drought broke in 2010-11. For river operators, sustained inflows meant water releases to manage airspace and mitigate flood risk occurred throughout the year in the Murrumbidgee and at Lake Hume.
The Menindee Lakes, in south-west NSW, also filled for the first time since 2012. This supported deliveries into the lower Murray, and reduced reliance on upstream storages in 2021-22. On the 30 June 2022:
- Murray storages (Lake Hume and Dartmouth) were 94% full (2,192 GL more than 1 July 2021).
- Lake Eildon was 82% full (802 GL more than 1 July 2021).
- Murrumbidgee storages (Blowering and Burrinjuck) were 93% full (89 GL less than 1 July 2021).

Figure 4.Volume held in storage, southern Murray-Darling Basin major headwater storages, January 2000 to June 2022.
Source: Aither 2022. Based on Bureau of Meteorology, 2022.
Note: Volumes presented are accessible storage volume. This is the volume of water that can be accessed under normal circumstances and equals the total storage volume excluding dead storage volume. See Figure Notes.
2.3 Allocations
Largest total volume of water allocated to major southern MDB entitlements in fifteen years.
The total volume of water allocated to major southern MDB entitlements (including environmental water holdings) was the highest observed since Aither’s data series commenced in 2007-08. Total water allocations were 7,450 GL, 22% more than the volume of water allocated in 2020-21 (approximately 6,100 GL). It is also 545 GL more than the volume allocated in the last wet year, 2016-17 (Figure 5).
The major drivers behind record new season water allocations were:
- maximum allocations to NSW Murray GS (110%). In comparison, in 2016-17, NSW Murray GS received 100% allocations.
- full allocations (100%) to Vic 6 Murray LRWS and Vic 7 Murray LRWS. This is only the second time Vic Murray LRWS entitlements have been allocated water since unbundling in 2007-08. The last time these entitlements were allocated water was in 2016-17, but the allocation was only 5%.

Figure 5. Estimated total volume of water allocated to major water entitlements in the southern Murray-Darling Basin, 2007-08 to 2021-22.
Source: Aither 2022. Based on Victorian, New South Wales and South Australian water registers, 2022.
Note: Allocations to all entitlement categories are shown, including allocations to environmental water and Victorian water corporation holdings. Excludes carryover and distributions from irrigation corporations.
Full allocations reached earlier in 2021-22 than in 2020-21.
This year saw full allocations to major southern MDB entitlements in all systems occurring much earlier in the year compared to 2020-21 (Figure 6). This was good news for irrigators because it provided certainty on water availability well before summer cropping decisions needed to be made.
Vic Murray HRWS, Vic Goulburn HRWS and SA Murray HS reached 100% between July and October, before peak irrigation season. This is two to four months earlier than in 2020-21 when these entitlements reached 100% between August and March.
NSW Murray HS and NSW Murrumbidgee HS received their full allocations on 1 July 2021 (97% and 95% respectively); then increased to 100% allocations in mid-October and early November 2021, respectively.
Vic Murray LRWS can only receive allocations once there is a very high likelihood of receiving 100% allocations to Vic Murray HRWS in the next water year. Allocations to Vic Murray LRWS started at 12% in December 2021, before quickly ramping up to 100% by February 2022.
Allocations to Vic Murray LRWS meant water carried over on these entitlements from 2020-21 was moved into spillable accounts. The net effect of the allocation against LRWS on total water availability was much less though because Lake Hume was spilling carryover.
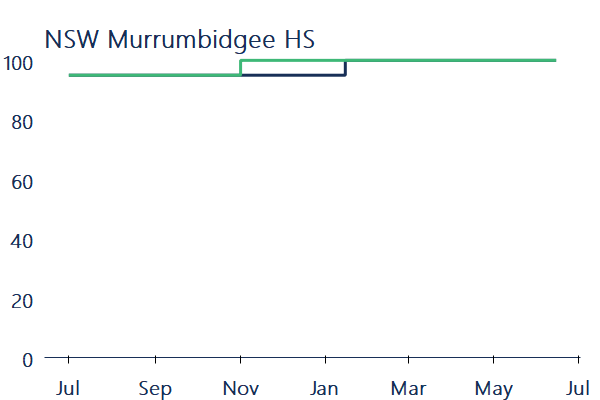
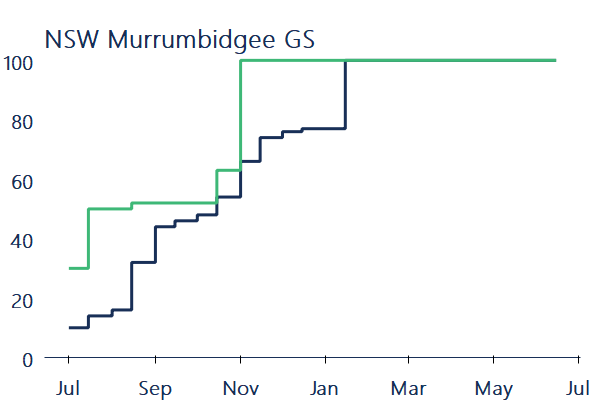
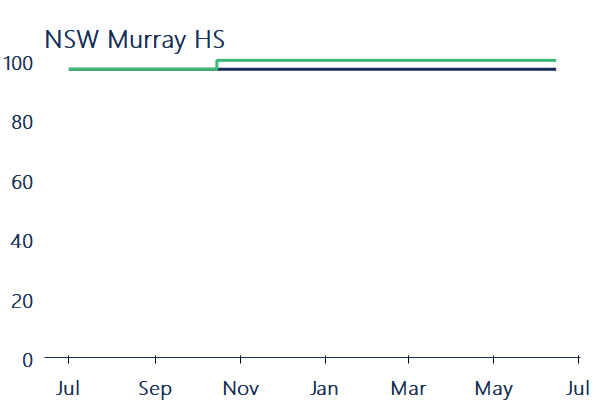
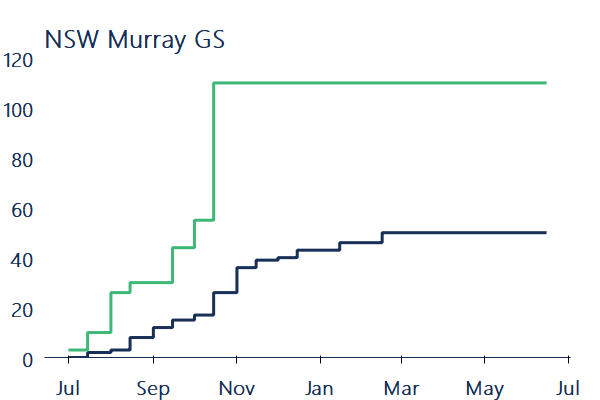
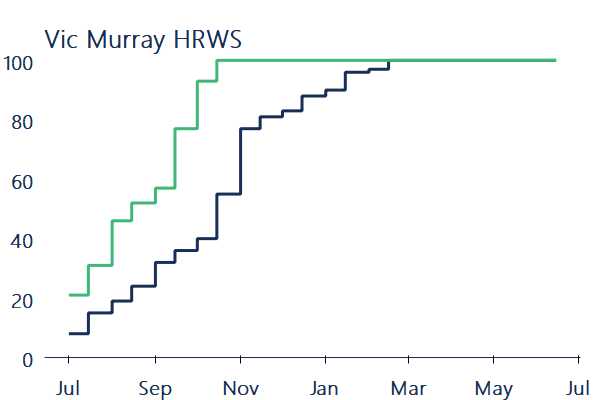
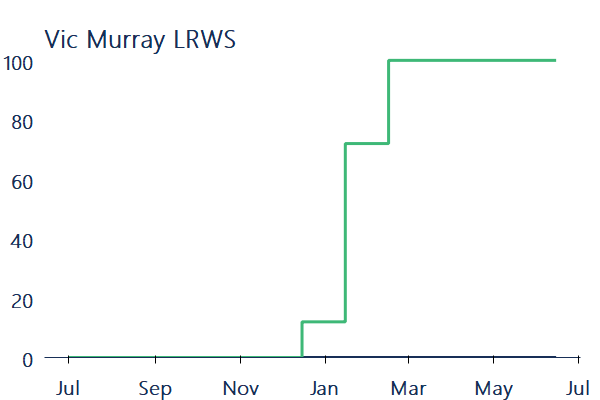
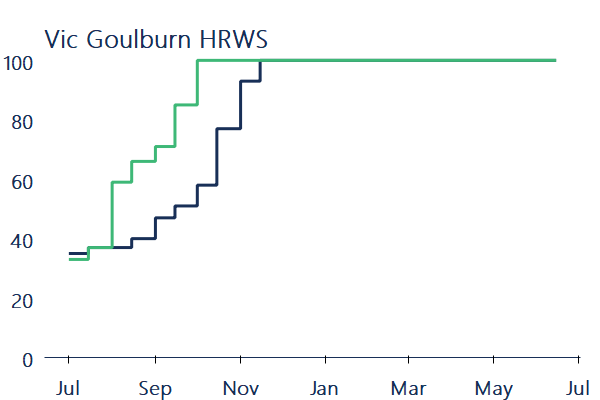
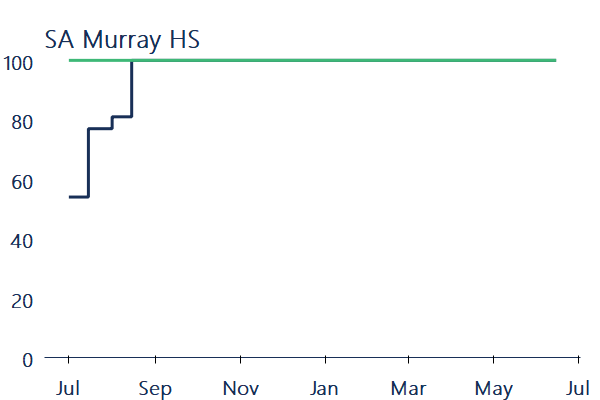

Figure 6. Water allocation determinations made to major southern Murray-Darling Basin entitlements, 2020-21 and 2021-22.
Source: Aither 2022. Based on Victorian, New South Wales and South Australian water registers, 2022.
2.4 Cropping patterns
Widespread and persistent in-crop rainfall bolstered annual cropping regions.
Wet conditions across most of 2021-22 were reflected in on-farm rainfall throughout annual cropping regions. In most regions, rainfall was well above median monthly rainfall throughout the year (Figure 7).
2021-22 marked the second year in a row of high early season allocations to general security entitlements, and strong commodity prices, especially for cotton and rice. These factors meant that many annual croppers committed to even larger planting programs than in 2020-21.
Compared to 2020-21, the area planted to cotton in NSW increased by 111% (193,000 to 406,000 ha). It was the largest area planted to cotton over the last 30 years (when ABARES records began). The area planted to rice in NSW increased 35% (45,100 to 61,000 ha) (ABARES, 2022).
The wet conditions caused some challenges though. November rainfall and flooding, particularly in the Murrumbidgee, damaged some early sown crops, but the beneficial conditions generally supported good plant establishment. Continued rain in January and February meant that the need for additional watering of summer crops was limited. Overall, this meant that many annual croppers’ water use was well down on their water budgets.
Rainfall was generally lower in Mildura (lower Murray) and Berri (SA Riverlands) than the regions further upstream. This reflects the fact that this part of the Basin missed out on the above average rainfall for the year (see Figure 3, p.11).
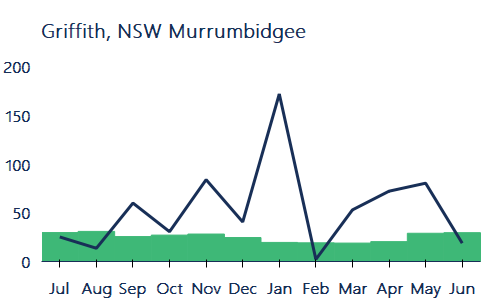
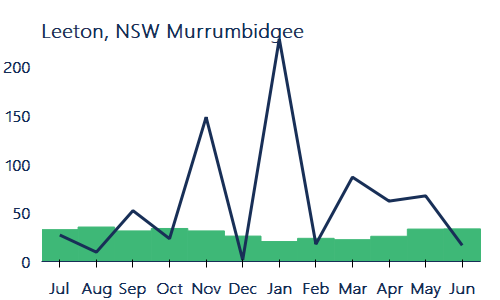
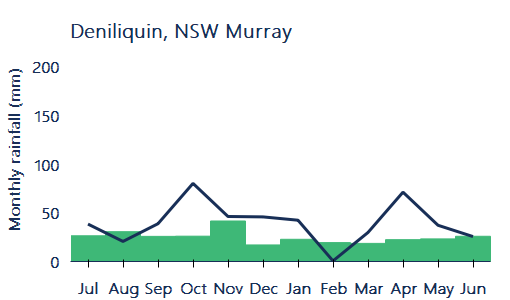
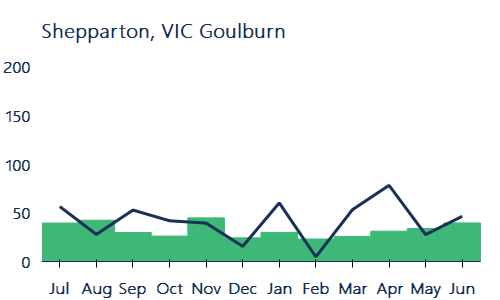
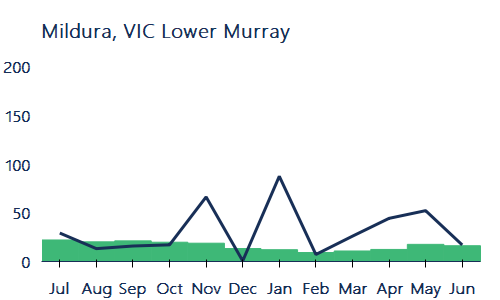


Figure 7. Monthly observed and median rainfall in southern Murray-Darling Basin annual cropping regions, 2021-22.
Source: Aither 2022. Based on Bureau of Meteorology, 2022.
Note: Time period over which median rainfall is calculated varies by location. See Figure Notes.
Left axis – Monthly rainfall (mm)
2.5 Demand for Water
Water use across the southern MDB slightly higher than 2020-21 volumes.
Total water use in NSW and Victoria (including usage against held environmental water accounts) was slightly higher than 2020-21 levels, increasing by 6% (Figure 8). Despite increased water availability and annual crop production, which would typically increase water use, consistent and timely in-crop rainfall suppressed demand across the season. This is evident particularly in the NSW Murray and Murrumbidgee systems.
Water usage in the NSW Murrumbidgee decreased 10% from 2020-21 (1,507 GL in 2020-21 to 1,352 GL in 2021-22) and was 9% lower than 2016-17 when it was 1,477 GL.
Maximum allocations to NSW Murray GS entitlements that were announced by mid-October 2021 supported increased annual crop plantings and a 15% increase in water use in the NSW Murray in 2021-22 compared to 2020-21. Although end of season allocations to NSW Murray GS entitlements were higher in 2021-22 compared to 2016-17, usage against these entitlements was 9% lower.
Water use in the Victorian Murray remained consistent with 2020-21 volumes (up 3%). This consistency across years demonstrates that water demand remains relatively inelastic, particularly in the lower Murray due to the inflexible water requirements of permanent horticulture plantings.
In the Goulburn, water use increased by 30% compared to 2020-21, which was likely driven by increased irrigation from dairy farmers given the low water allocation prices and strong milk prices.

Figure 8.Water usage in the Murrumbidgee, Murray (Victoria and NSW only) and Goulburn systems, 2016-17 to 2021-22.
Source: Aither 2022. Based on Victorian and New South Wales water registers, 2022.
Note: Water usage in the NSW Murrumbidgee and Murray is based on usage against HS and GS entitlements only (consumptive and environment), retrieved 22 July 2022. Water usage in the Victorian Murray and Goulburn is based on usage against HRWS and LRWS accounts in Vic 1A Greater Goulburn, Vic 6 Murray and Vic 7 Murray.
2.6 Implications for the Market
A second year of wet conditions produced the ‘double whammy’ effect on allocation prices.
In 2021-22, water allocation prices trended downwards for the second consecutive year. The annual volume weighted average price (VWAP) across major trading zones in the southern MDB was $71 per ML in 2021-22 (Figure 9).
The wet conditions in 2021-22 had a ‘double whammy’ effect on allocation prices. Maximum allocations to most major entitlements meant irrigators had a lot of water in their accounts for use or trade. However, high in-crop rainfall also meant that annual croppers did not need to draw on the water in their accounts, nor purchase allocations on the market. When these factors combine it creates a ‘double whammy’ effect, placing very strong downwards pressure on allocation prices.
The last time the ‘double whammy’ effect was particularly evident was in 2016-17, the last wet year in the southern MDB. In both years, monthly VWAPs followed the same trend throughout the year. In July 2021, average allocation VWAPs across the southern MDB were around $126 per ML, and decreased as low as $18 per ML in June 2022. This mirrors the 2016-17 trend ($156 per ML in July and $21 per ML in May).
The key differences between these years were:
- In 2016-17 allocation prices fell rapidly from July to October, driven in part by the record-breaking rainfall in late spring / early summer. In 2021-22, rainfall was consistent throughout the year, which produced a steadier downwards trend in water allocation prices.
- In 2021-22, the water available was 8.5% higher than in 2016-17, but the annual VWAP of $71 per ML was higher than the annual VWAP in 2016-17 when it was $58 per ML.

Figure 9. Annual and monthly volume weighted average prices, and total water available to major entitlements in the southern Murray-Darling Basin (including carryover), 2007-08 to 2021-22.
Source: Aither 2022. Based on Victorian, New South Wales and South Australian water registers, 2022.
Note: High Reliability / Security and Low Reliability / General Security entitlements are included for the following zones: NSW Murray 10, NSW Murray 11, NSW Murrumbidgee, Vic 1A Greater Goulburn, Vic 6 Murray, Vic 7 Murray, and SA Murray HS (Class 3).
See Figure Notes.
3.1 Allocation Trade Prices
Despite second year of allocation price decreases, 2021-22 prices were still higher than 2016-17 prices.
For the second year in a row, annual water allocation prices decreased in 2021-22. Compared to prices in 2020-21, annual volume weighted average prices (VWAPs) were between 30% and 55% lower across the major trading zones in the southern MDB (Table 1).
Annual VWAPs peaked in 2019-20. Compared to that year, 2021-22 allocation prices were between 78% and 90% lower, with NSW Murrumbidgee experiencing the largest decrease from 2019-20 prices ($586 to $57 per ML).
Despite prices trending downwards, 2021-22 annual VWAPs were still mostly higher than 2016-17 VWAPs, which was the last wet year in the southern MDB. This was most evident in the lower Murray where 2021-22 prices were between 36% (Vic 7 Murray) and 42% (NSW 11 Murray) higher than 2016-17 annual VWAPs. This reflects, in part, structural changes from the intensification of permanent horticulture plantings in the lower Murray. In the upstream zones, compared to 2016-17, annual VWAPs in 2021-22 were higher in NSW (up 12% to 34%), but lower in Vic 1A Greater Goulburn and Vic 6 Murray (down 2% to 11%).
Downstream zones in 2021-22 also traded at a premium compared to upstream zones. Annual VWAPs in the lower Murray were between $86 per ML and $104 per ML, while upstream prices were between $54 per ML and $66 per ML (Table 1). In percentage terms, these are some of the largest price differentials seen in the southern MDB.
The estimated value of commercial allocation trade in major southern MDB trading zones was $94 million. This is lower than the $189 million reported in 2020-21, but higher than the estimate of commercial allocation trade in 2016-17 ($60 million).
Table 1. Annual volume weighted average prices, major southern Murray-Darling Basin trading zones, 2019-20 to 2021-22.
|
Trading zone
|
VWAP 2019-20 ($/ML)
|
VWAP 2020-21 ($/ML)
|
VWAP 2021-22 ($/ML)
|
Change in price 2020-21 to 2021-22 (%)
|
Change in price 2019-20 to 2021-22 (%)
|
|---|---|---|---|---|---|
|
Vic 1A Greater Goulburn
|
$511
|
$116
|
$54
|
-53%
|
-89%
|
|
Vic 6 Murray (Dart to Barmah)
|
$499
|
$129
|
$58
|
-55%
|
-88%
|
|
Vic 7 Murray (Barmah to SA)
|
$644
|
$160
|
$89
|
-44%
|
-86%
|
|
NSW Murray (above Barmah)
|
$304
|
$95
|
$66
|
-30%
|
-78%
|
|
NSW Murray (below Barmah)
|
$622
|
$154
|
$86
|
-44%
|
-86%
|
|
NSW Murrumbidgee
|
$586
|
$96
|
$57
|
-41%
|
-90%
|
|
SA Murray
|
$629
|
$191
|
$104
|
-46%
|
-84%
|
3.2 Comparison of Allocation Trade Prices
Allocation prices dropped steadily throughout 2021-22 producing the largest July-June decrease since 2010-11.
Wet conditions and consistent in-crop rainfall meant water allocation prices in all trading zones decreased throughout the year. However, prices generally held up in the first half of the year. Then, allocations to Vic Murray LRWS, the end of the irrigation season, and limited carryover space combined to place further downwards pressure on prices in all zones. This meant prices tumbled quickly from January 2021 to the end of the water year (Figure 10). These dynamics produced the largest percentage decrease in water allocation prices between the start and the end of the water year seen since 2010-11.
The lowest weekly VWAPs, based on water register data, for each trading zone were:
- Combined Goulburn $16 per ML (end-June).
- Murray (above Barmah) $3 per ML (mid-June).
- Murray (below Barmah) $17 per ML (end-June).
- Murrumbidgee $3 per ML (end-May).
These weekly VWAPs reflect price decreases between 85% and 98% compared to early-season prices.
The three trade constraints were closed for most of the year. Towards the end of the year, prices in the Goulburn and Murray (above and below Barmah) equalised as downstream trade opened. Due to the high water availability and binding trade constraints, prices in the Murrumbidgee remained much lower than prices in the lower Murray.

Figure 10.Weekly volume weighted average prices, major southern Murray-Darling Basin trading zones, 2021-22.
Source: Aither, 2022. Based on Victorian, New South Wales, and South Australian water registers, 2022.

Figure 11. Weekly transfer and trade volumes (within and into), major southern Murray-Darling Basin trading zones, 2021-22.
Source: Aither, 2022. Based on Victorian, New South Wales, and South Australian water registers, 2022.
3.3 Allocation Trade Activity
Limited carryover space and high risk of spill in Victorian Murray reverses the typical net trade from SA Murray.
Allocation transfer trends across the southern MDB in 2021-22 were broadly consistent with historical trends. Consistent with the last four years, Vic 7 Murray (Barmah to SA) was the largest net exporter of water allocations, and SA Murray was the largest net importer of allocations. The Murrumbidgee remained a net exporter, but only exported 94 GL, which is 69% lower than 2020-21 (Table 2).
The analysis in Table 2 includes all water transfers, including those recorded on water registers at $0 and other non-commercial transactions (such as environmental transfers), which can be substantial in volume. Estimates of commercial water allocation trade activity are made by excluding $0 transfers (Table 3).
The 2021-22 net change in commercial trade for Vic 7 Murray was +40 GL, making this zone a net importer. While this is a smaller volume than in 2020-21 (103 GL) and 2019-20 (115 GL), it potentially shows the influence of structural changes on water demand. That is, even in years with large cotton production in the Murrumbidgee such as this year, demand for water in the lower Murray can remain the dominant driver.
Vic 1A Goulburn returned to being a net exporter of commercial trade in 2021-22, after two years of being a net importer. This reflects the relatively small volumes of back trade this year because of the limited carryover space available and market participants’ expectations for low allocation prices in 2022-23. Notably, SA Murray – which is typically a net exporter of commercial allocation trade – was a net importer in 2021-22. This likely reflects water market participants’ decision-making around carryover. With limited carryover space on Vic 7 Murray LRWS, and the high risk of spill in the Victorian Murray, there has not been the same demand to move water out of South Australia to carryover on Victorian entitlements.
Table 2. Allocation transfer numbers and volumes, major southern Murray-Darling Basin trading zones (all reported trades) 2021-22.
|
Trading Zone
|
Within
|
Into
|
Out of
|
Net Change (ML)
|
|||||||||
|---|---|---|---|---|---|---|---|---|---|---|---|---|---|
|
Vic 1A Greater Goulburn
|
4,532
|
1,120,826
|
810
|
190,389
|
625
|
207,233
|
-16,844
|
||||||
|
Vic 6 Murray (Dart to Barmah)
|
1,004
|
297,551
|
90
|
47,411
|
236
|
109,290
|
-61,879
|
||||||
|
Vic 7 Murray (Barmah to SA)
|
4,536
|
576,641
|
1,207
|
340,582
|
849
|
839,206
|
-498,624
|
||||||
|
NSW Murray (above Barmah)
|
164
|
324,744
|
93
|
70,709
|
93
|
65,469
|
5,240
|
||||||
|
NSW Murray (below Barmah)
|
972
|
158,061
|
226
|
170,729
|
621
|
215,557
|
-44,828
|
||||||
|
NSW Murrumbidgee
|
1,409
|
968,931
|
6
|
6,037
|
26
|
100,082
|
-94,045
|
||||||
|
SA Murray
|
852
|
319,727
|
499
|
758,461
|
211
|
63,601
|
694,860
|
||||||
|
Total
|
13,469
|
3,766,482
|
2,931
|
1,584,319
|
2,661
|
1,600,439
|
|||||||
Table 3. Allocation transfer numbers and volumes, major southern Murray-Darling Basin trading zones (priced trades, i.e., excluding $0 transfers) 2021-22.
|
Trading zone
|
Within
|
Into
|
Out of
|
Net change (ML)
|
|||||||||
|---|---|---|---|---|---|---|---|---|---|---|---|---|---|
|
Vic 1A Greater Goulburn
|
3,180
|
368,182
|
544
|
64,382
|
356
|
59,294
|
5,088
|
||||||
|
Vic 6 Murray (Dart to Barmah)
|
734
|
114,659
|
51
|
12,734
|
73
|
17,642
|
-4,908
|
||||||
|
Vic 7 Murray (Barmah to SA)
|
3,408
|
347,039
|
716
|
142,798
|
578
|
102,852
|
39,946
|
||||||
|
NSW Murray (above Barmah)
|
67
|
27,457
|
48
|
14,117
|
32
|
11,370
|
2,747
|
||||||
|
NSW Murray (above Barmah)
|
684
|
104,795
|
106
|
17,543
|
476
|
110,633
|
-93,090
|
||||||
|
NSW Murrumbidgee
|
1,084
|
462,278
|
2
|
197
|
2
|
1,500
|
-1,303
|
||||||
|
SA Murray
|
398
|
54,182
|
351
|
71,656
|
169
|
33,731
|
37,925
|
||||||
|
Total
|
9,555
|
1,478,591
|
1,818
|
323,426
|
1,686
|
337,021
|
|||||||
3.4 Comparison of allocation market activity
Allocation market activity suppressed by high water availability, limited carryover space.
Despite high allocations to general security and low reliability entitlements, the large volume of water allocated did not lead to increased allocation market activity compared to last water year. This was driven by the wet conditions that reduced market participants’ reliance on allocation markets.
Reduced allocation market transfer and trade activity was particularly evident in the lower Murray. The combined trade and transfer activity across NSW Murray (below Barmah), Vic 7 Murray and SA Murray decreased by 12% compared to 2020-21. In contrast, compared to 2020-21, the volume of annual transfers or trades increased by 39% in Vic 1A Greater Goulburn, and were about the same in the NSW Murrumbidgee (Figure 12).
Allocation market activity was particularly quiet in late spring and across peak irrigation season compared to 2020-21. This reflects the wet summer conditions and the fact that many irrigators had large volumes of water in their accounts and they could afford to be patient.
As is typical in wet years, total allocation market activity across the southern MDB picked up in the final months of the water year (up 21% compared to 2020-21). However, there were differences between systems, which likely reflects the challenges of finding carryover space, the high risk of spill in the Victorian Murray, and market participants expectations for low allocation prices in 2022-23. In the final quarter of 2021-22, trade and transfer activity was less than for the same period last water year in NSW Murray (below Barmah) (-62%) and Vic 7 Murray (-27%), while it was higher in Vic 1A Greater Goulburn (+63%) and the NSW Murrumbidgee (+27%).

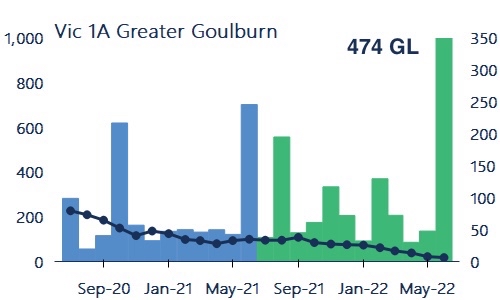

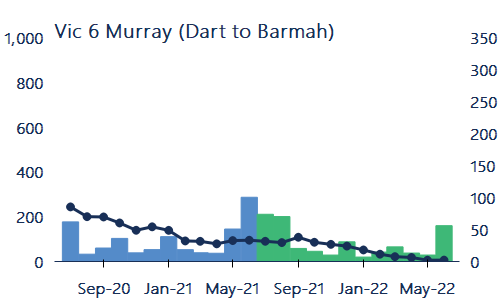
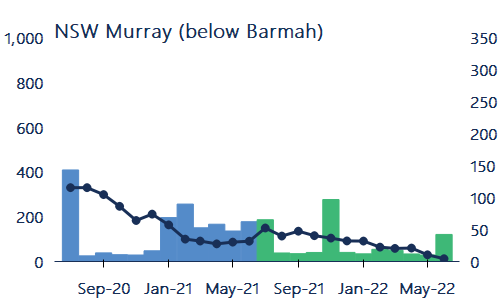
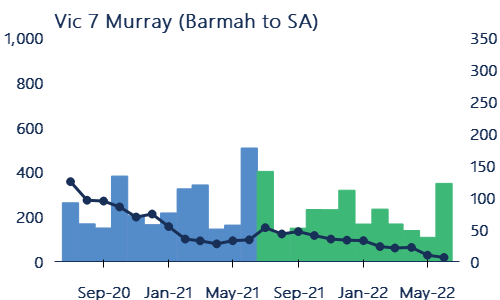
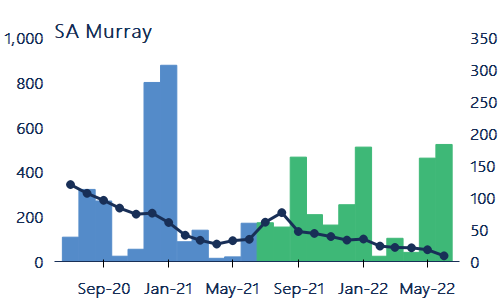

Figure 12. Monthly volume weighted average prices, and transfer and trade volumes (within and into), major southern Murray-Darling Basin trading zones, 2020-21 to 2021-22.
Source: Aither, 2022. Based on Victorian, New South Wales, and South Australian water registers, 2022.
See Figure Notes.
3.5 Allocation trade activity in the upper Murray
Upper Murray allocation trade activity increased by 5% compared to 2020-21.
Data on water market trade activity in irrigation corporations is important to build a more complete picture of allocation trade activity than can be done with state water register data alone.
Although data on irrigation corporation trade activity are limited, Murray Irrigation Limited provide aggregated daily water allocation sales data on its website. Continuing from last year, Aither combined these data with data from the NSW and Victorian water registers to show what happened in the upper Murray in 2021-22.
In 2021-22, 354 GL of allocations were traded or transferred in the upper Murray. This compares to 339 GL in 2020-21.
Monthly allocation trade and transfer volumes were generally steady throughout 2021-22. Trade activity peaked in September and October 2021 in line with the announcements for increased allocations to NSW Murray GS entitlements at this time (Figure 15). Trade activity picked up again in March 2022 with the end of summer irrigation and the start of the winter cropping period.
Trade and transfer activity in June 2022 was 30% lower than in June 2021. This likely reflects the fact that much of the carryover space in the upper Murray was full due to maximum allocations to NSW Murray GS entitlements, and reduced demand because of the consistent in-crop rainfall. This is supported by the much lower volume of back trade through the Barmah Choke in June 2022 compared to last water year. The Barmah Choke balance reached almost 14 GL on the 30 June 2022, compared to 139 GL on the 30 June 2021 (MDBA, 2021, 2022).

Figure 13. Monthly allocation transfer and trade volumes, NSW and Victorian Murray (above Barmah) 2021-22.
Source: Aither, 2022. Based on NSW and Victorian water registers. Murray Irrigation Limited, 2022.
Note: Volumes from the NSW and Victorian water registers include all volumes transferred or traded (within and into zones 6 and 10). Volumes transferred or traded within Murray Irrigation Limited were accessed 22 June 2022.
3.6 Trade constraints
Few downstream trade opportunities in 2021-22.
Trade constraints limit movement of water allocations between southern MDB markets. When this happens they can alter within region water supply and demand dynamics and create price differentials between upstream and downstream zones.
As expected, downstream trade opportunities opened on 1 July 2021:
- 31 GL upper Murray to lower Murray (MDBA, 2021).
- 48 GL Goulburn to lower Murray (VWR, 2021).
However, these opportunities were exhausted within hours, with no real opportunity for the rest of 2021-22. The Goulburn to Murray interim trade rule enabled small openings in November and December 2021 (Figure 14).
The maximum price differentials based on weekly VWAPs were in mid-August 2021:
- Between Murrumbidgee and lower Murray: $90 per ML.
- Between Goulburn and lower Murray: $83 per ML.
- Between upper Murray and lower Murray: $93 per ML.
End-of-year downstream trade opportunities from the Goulburn started from late May, but were smaller than 2020-21. It was almost the end of the water year before downstream trade opportunities through the Barmah Choke emerged from back trade into the upper Murray. This reflects the limited carryover space available, water market participants’ low appetite to buy carryover ahead of a likely wet 2022-23, and a very high risk of spill in the Victorian Murray and Goulburn.
There was only one trade opportunity from the Murrumbidgee to the Murray in 2021-22, a 100 GL opportunity on 15 November 2021.


Figure 14. Upstream to downstream trade opportunities (end-of-day) during 2021-22 with weekly allocation volume weighted average prices showing price divergence and equalisation.
Source: Aither, 2022. Based on Victorian and New South Wales water registers, 2022.
See Figure Notes.
3.7 Purpose of allocation trade
First full year of data on purpose of allocation transfer and trade activity in NSW and Victoria
2021-22 was the first full water year after the NSW and Victorian governments started to report information about the purpose of allocation transfers and trades.
Figure 15 shows the monthly volume of transfers or trades by purpose in Victoria and NSW, split into priced and $0 trades/transfers for 2021-22.
A purpose of trade was reported for 98% of priced trades and 72% of $0 trades or transfers. This compares to 82% of priced trades and 52% of $0 trades or transfers in 2020-21.
The increased number of trades with a reported purpose reflects the fact that there is now a full water year’s worth of data. Last water year (2020-21), the trades without a reported purpose were Victorian trades that were either submitted prior to 27 August 2020 when purpose of trade / transfer was first required or on a paper form.
Priced trades in 2021-22 were comprised of:
- 79% standard commercial trades.
- 9% delivery of allocations under forward contracts or entitlement leases.
- 8% carryover trades, although carryover accounted for 44% of trades in June 2022.
$0 transfers in 2021-22 were comprised of:
- 39% related party transfers.
- 18% environmental use and 6% returned environmental water. In June 2022, returned environmental water accounted for 22% of allocation trades.
- 6% carryover parking return, mainly in July 2021 when it was for 31% of all $0 allocation trades or transfers.


Figure 15. Volume traded by purpose of transfer / trade in major southern MDB trading zones, 2021-22.
Source: Aither, 2022. Based on NSW and Victorian water registers, 2022.
See Figure Notes.
4.1 Entitlement trade prices
High reliability and high security entitlement prices at or near all-time highs.
Annual VWAPs (based on state water register data) for most high reliability and high security entitlements generally rose in 2021-22 after small decreases in 2020-21 (Table 4).
For most HRWS and HS entitlements, the 2021-22 VWAPs are the highest of all time reported by Aither. The exception was Vic 1A Greater Goulburn HRWS which remained steady with 2020-21 prices.
A return to increasing annual VWAPs for HRWS and HS entitlements reflects strong economic conditions for most irrigated agricultural industries. Based on our market intelligence, it also reflects a return of market confidence after the release of the final report from the ACCC’s inquiry into water markets (March 2021).
Second year of price increases for low reliability and general security entitlements.
In line with the continued wet conditions and full allocations to entitlements, GS entitlement prices increased for the second year in a row. Market participants also continued to value carryover space with all Victorian LRWS annual VWAPs increasing. The largest increase was for Vic 7 Murray LRWS up 64%.
The 2021-22 annual VWAPs for GS and LRWS entitlements are the highest of all time reported by Aither. The exception is NSW Murray GS (a combination of zones 10 and 11), which peaked in 2018-19 at $1,964 / ML.
Table 4. Annual transfer volumes and volume weighted average prices, major southern Murray-Darling Basin entitlements, 2020-21 and 2021-22.
|
Entitlement type
|
No. traded
|
Volume traded (ML)
|
Annual VWAP ($/ML)
|
Annual change in price (%)
|
Change in price 2019-20 to 2021-22 (%)
|
|||
|---|---|---|---|---|---|---|---|---|
|
Vic 1A Greater Goulburn HRWS
|
773
|
36,132
|
$4,084
|
$4,084
|
0%
|
-9%
|
||
|
Vic 1A Greater Goulburn LRWS
|
370
|
25,021
|
$429
|
$612
|
43%
|
53%
|
||
|
Vic 6 Murray (Dart to Barmah) HRWS
|
223
|
13,542
|
$4,466
|
$4,903
|
10%
|
2%
|
||
|
Vic 6 Murray (Dart to Barmah) LRWS
|
113
|
7,949
|
$543
|
$649
|
20%
|
17%
|
||
|
Vic 7 Murray (Barmah to SA) HRWS
|
856
|
40,455
|
$6,157
|
$7,111
|
15%
|
27%
|
||
|
Vic 7 Murray (Barmah to SA) LRWS
|
159
|
8,406
|
$928
|
$1,526
|
64%
|
133%
|
||
|
NSW Murray GS
|
55
|
22,590
|
$1,870
|
$1,968
|
5%
|
7%
|
||
|
NSW Murray HS
|
54
|
2,586
|
$8,386
|
$8,856
|
6%
|
6%
|
||
|
NSW Murrumbidgee GS
|
39
|
42,546
|
$2,029
|
$2,457
|
21%
|
27%
|
||
|
NSW Murrumbidgee HS
|
28
|
2,536
|
$7,179
|
$8,246
|
15%
|
10%
|
||
|
SA Murray HS
|
208
|
11,240
|
$6,815
|
$7,473
|
10%
|
8%
|
||
|
TOTAL
|
2,878
|
213,003
|
||||||
Note: Note: NSW Murray HS and NSW Murray GS are a combination of entitlement trades in zones 10 and 11. The aggregation of these data reflect the way NSW Murray HS and GS trades are reported on the NSW Water Register. Volume weighted average prices generated from state water register trade data may differ from market values See Table Notes.
4.2 Comparison of trade prices and volume
High reliability and high security entitlements
Monthly VWAPs between July 2021 and June 2022 increased for all HRWS and HS entitlements. There are three broad trends that can be seen across the different entitlements (Figure 16).
First, Vic 7 Murray HRWS had the largest price increase during 2021-22, up 27%. This was closely followed by NSW Murrumbidgee HS up 24%. Monthly VWAPs for these two entitlements hit all-time highs between January and June 2022. The total volume traded or transferred (excluding related party transfers) was also higher than in 2020-21. This growth trend reflects sustained interest from a range of water market participants for highly reliable water.
Growth in SA Murray HS, NSW Murray HS and Vic 6 Murray HRWS entitlement prices was more modest, all rising between 13% and 16% from July 2021 to June 2022. Trade or transfer volumes (excluding related party transfers) increased compared to 2020-21 by 16% for SA Murray HS and 2% for Vic 6 Murray HRWS. Trade or transfer activity for NSW Murray HS decreased between 2020-21 and 2021-22, but this is typically an inactive market.
Lastly, monthly VWAPs for Vic 1A Greater Goulburn HRWS held steady through 2021-22, with prices up only 2% over the year. Market activity was also steady (excluding related party transfers) for this entitlement.
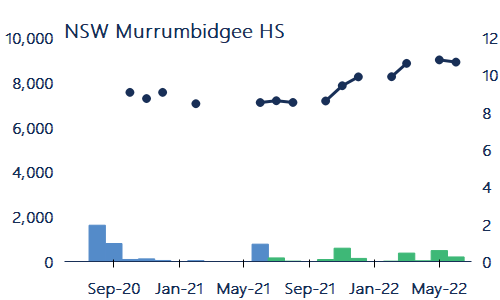
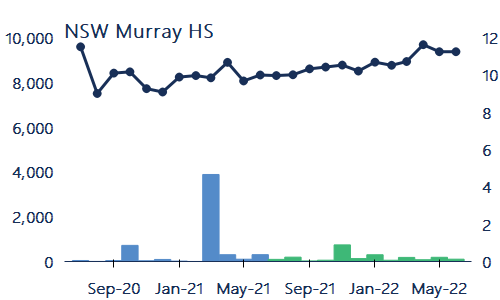
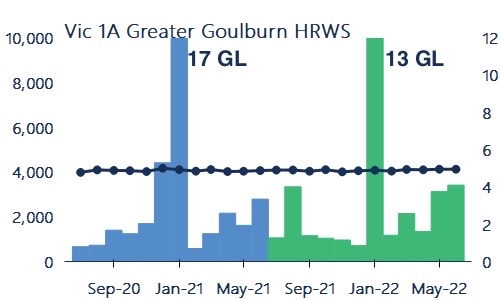
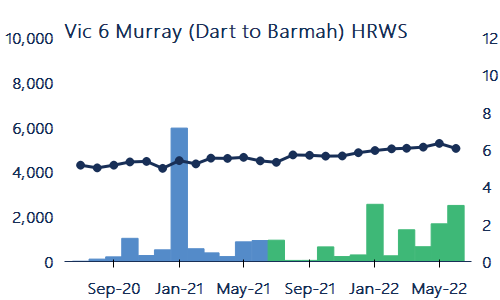
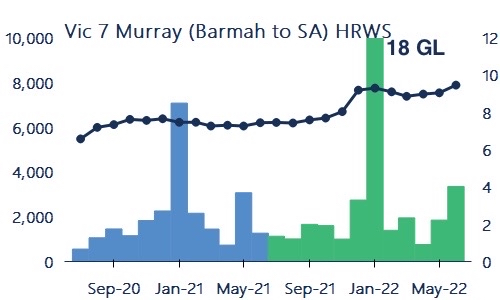
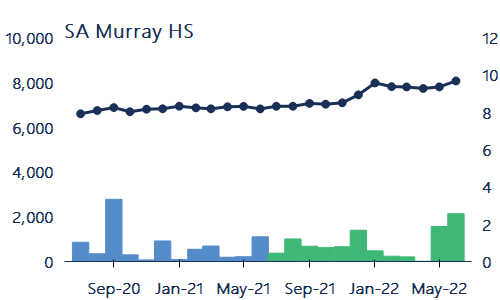

Figure 16.Monthly volume weighted average prices and transfer volumes (within and into), major southern Murray-Darling Basin high reliability and high security entitlements, 2020-21 to 2021-22.
Source: Aither, 2022. Based on Victorian, New South Wales and South Australian water registers, 2022.
Note: NSW Murray HS is a combination of entitlement trades in zones 10 and 11. The aggregation of these data reflect the way NSW Murray HS trades are reported on the NSW Water Register. See Figure Notes.
Left axis- Volume weighted average price ($/ML)
Right axis – Volume of water traded (GL)
Low reliability and general security entitlements.
Monthly VWAPs for low reliability entitlements increased steadily during 2021-22, peaking at the end of the year. The largest increases were for Vic 1A Greater Goulburn LRWS, Vic 6 Murray (Dart to Barmah) LRWS and Vic 7 Murray (Barmah to SA) LRWS, which increased 55%, 24% and 23% respectively between July 2021 and June 2022 (Figure 17).
The annual volumes traded or transferred also increased for Vic 1A Greater Goulburn LRWS and Vic 6 Murray LRWS (42% and 36% respectively). The volume traded or transferred for Vic 7 Murray LRWS, however, was down 24% for the year. This likely reflects the way that this entitlement is becoming tightly held as market participants continue to value relatively secure carryover space in the lower Murray.
Monthly VWAPs for NSW Murray GS and NSW Murrumbidgee GS (excluding trade within irrigation corporations) also increased in 2021-22, up 61% and 17% respectively. This is on the back of increased allocations to these entitlements and strong outlooks for 2022-23.
Market activity for NSW Murray GS appears to have decreased 20% between 2020-21 and 2021-22, although this is due to a related party transfer (recorded at $0) for 14.4 GL in 2020-21. Excluding these transfers results in a 63% increase in the volume traded or transferred between 2020-21 and 2021-22.
It’s a similar story for NSW Murrumbidgee GS where market activity was down 43% from 2020-21. However, when large, related party trades from August and March in 2020-21 and June in 2021-22 are removed, the volume traded and transferred increased 35% between 2020-21 and 2021-22.
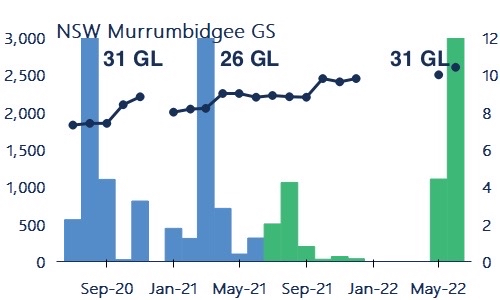
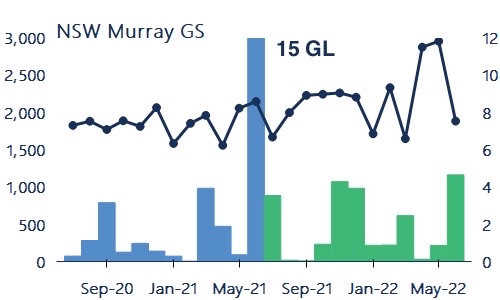

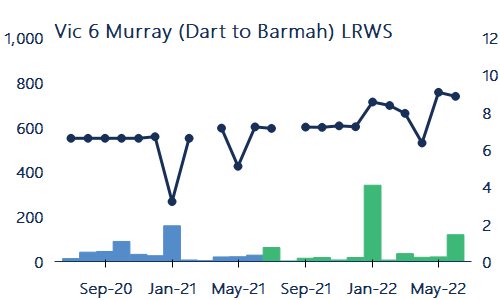
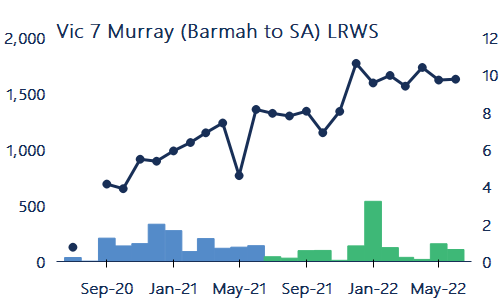

Figure 17. Monthly volume weighted average prices and transfer volumes (within and into), major southern Murray-Darling Basin low reliability and general security entitlements, 2020-21 to 2021-22.
Note: Price axes differ across the charts above, reflecting the general price differences between entitlements.
Note: Vic 7 LRWS May 2021 VWAP is $767 per ML following two trades recorded at $150 and $450 per ML which is likely a typographical error in the register. Vic 6 LRWS January 2021 VWAP is $267 per ML following a trade recorded at $250 per ML.
Note: NSW Murray GS is a combination of entitlement trades in zones 10 and 11. The aggregation of these data reflect the way NSW Murray GS trades are reported on the NSW Water Register. All statistics reported for NSW Murrumbidgee GS and NSW Murray GS exclude trades within irrigation corporations. See Figure Notes.
Left axis- Volume weighted average price ($/ML)
Right axis – Volume of water traded (GL)
4.3 Total entitlement market size and value
Value of southern MDB entitlements hits an all-time high of $30 billion.
A large proportion of water entitlement trading in Australia is contained within the southern MDB. In 2021-22, the estimated total value of major entitlements on issue in the southern MDB increased by 13% from 2020-21 ($26.5 billion, 0.7% higher than in 2019-20). This estimate is based on annual VWAPs generated from state water register data, which can often lag market prices, particularly in years when entitlement prices are rising as they have done in 2021-22.
The estimated market value in 2021-22 was approximately $30.0 billion (Table 5). While there was more entitlement on issue in 2021-22, following the Irrigators’ Share Distribution in Victoria, this increase only contributed around $200 million of the increase in the total value of major entitlements on issue.
The increased value of entitlements on issue from 2020-21 follows the modest increase the year prior and re-establishes the trend of strong growth in entitlement prices over the past decade. Since Aither first estimated the value of entitlements on issue in the 2014-15 Aither Water Markets Report, the combined value of entitlements in the southern MDB has more than tripled from $9.1 billion to $30.0 billion.
The estimated value of environmental water holdings in the southern MDB increased 12% from 2020-21. In 2021-22, environmental water holdings represent around 26% or $7.8 billion of the total value of entitlements on issue.
Table 5. Volume of entitlements on issue, annual prices and estimates of market size, major southern Murray-Darling Basin entitlements, 2021-22.
|
Entitlement type
|
Total entitlement on issue (ML)
|
Environmental held entitlements (ML)
|
VWAP ($/ML) 2021-22
|
Estimated value of entitlements on issue (million)
|
Estimated value of environmental entitlements (million)
|
|---|---|---|---|---|---|
|
Vic 1A Greater Goulburn HRWS
|
1,010,050
|
302,160
|
$4,084
|
$4,125
|
$1,234
|
|
Vic 1A Greater Goulburn LRWS
|
443,320
|
49,090
|
$612
|
$271
|
$30
|
|
Vic 6 Murray (Dart to Barmah) HRWS
|
326,770
|
117,340
|
$4,903
|
$1,602
|
$575
|
|
Vic 6 Murray (Dart to Barmah) LRWS
|
135,510
|
18,180
|
$649
|
$88
|
$12
|
|
Vic 7 Murray (Barmah to SA) HRWS
|
945,690
|
268,030
|
$7,111
|
$6,724
|
$1,906
|
|
Vic 7 Murray (Barmah to SA) LRWS
|
184,747
|
23,390
|
$1,526
|
$282
|
$36
|
|
NSW Murray 10 GS
|
1,301,236
|
364,760
|
$1,654
|
$2,152
|
$603
|
|
NSW Murray 10 HS
|
22,811
|
4,499
|
$7,000
|
$160
|
$31
|
|
NSW Murray 11 GS
|
372,860
|
119,913
|
$2,421
|
$903
|
$290
|
|
NSW Murray 11 HS
|
166,894
|
20,510
|
$8,958
|
$1,495
|
$184
|
|
NSW Murrumbidgee GS
|
1,891,995
|
478,391
|
$2,457
|
$4,649
|
$1,175
|
|
NSW Murrumbidgee HS
|
364,279
|
16,066
|
$8,246
|
$3,004
|
$132
|
|
SA Murray HS
|
608,000
|
207,000
|
$7,473
|
$4,544
|
$1,547
|
|
Total
|
7,774,164
|
1,989,329
|
|
$30,000
|
$7,757
|
Note: The volume weighted average prices shown above are generated from state water register trade data. These may differ from market values. The Aither Entitlement Index is based on Aither’s in-house fair market unit values that its water market specialists generate each month. See Table Notes.
4.4 Entitlement market turnover and returns
Entitlement volume traded or transferred decreases; market turnover value increases.
In 2021-22, the market turnover value for major southern MDB entitlements was around $812 million, a 5% increase compared to 2020-21 when the turnover value was $774 million (Table 6). This is still below the 2019-20 peak of $1.1 billion.
This increase in market turnover was almost entirely driven by Vic 7 Murray HRWS which saw increased volumes being traded or transferred (up 40% from 2020-21).
Compared to 2020-21, the number of trades or transfers increased by 37% although the total volume traded or transferred decreased 11%. This means the average parcel size of trades and transfers is becoming smaller. One driver of this is likely to be the Victorian water shares issued under the Irrigators’ Share Distribution following water savings made through the Connections Project.
Market turnover is the volume traded or transferred as a proportion of the estimated consumptive entitlement on issue. For major entitlements in the southern MDB, market turnover varied between 1% – 6% (average of 4%) (Table 6).
The combination of higher entitlement annual VWAPs and lower allocation prices meant that the returns to all entitlements in 2021-22 were lower compared to recent years. They were also lower than the returns reported by Aither in 2016-17. With allocations made to Vic Murray LRWS (6 & 7), both recorded a return in 2021-22, although actual returns will be lower than those shown in Table 6 due to the timing of when allocations were made to these entitlements.
Table 6. Entitlement market turnover and returns, major southern Murray-Darling Basin entitlements (outside irrigation corporations), 2021-22.
|
Entitlement type
|
No. traded
|
Volume traded (ML)
|
Estimated turnover value (million)
|
Estimated turnover (%)
|
Average annual gross return (%)
|
|---|---|---|---|---|---|
|
Vic 1A Greater Goulburn HRWS
|
773
|
36,132
|
$148
|
5%
|
1.3%
|
|
Vic 1A Greater Goulburn LRWS
|
370
|
25,021
|
$15
|
6%
|
0.0%
|
|
Vic 6 Murray (Dart to Barmah) HRWS
|
223
|
13,542
|
$66
|
6%
|
1.2%
|
|
Vic 6 Murray (Dart to Barmah) LRWS
|
113
|
7,949
|
$5
|
7%
|
9.0%
|
|
Vic 7 Murray (Barmah to SA) HRWS
|
856
|
40,455
|
$288
|
6%
|
1.3%
|
|
Vic 7 Murray (Barmah to SA) LRWS
|
159
|
8,406
|
$13
|
5%
|
5.8%
|
|
NSW Murray GS
|
55
|
22,590
|
$44
|
2%
|
4.9%
|
|
NSW Murray HS
|
54
|
2,586
|
$23
|
2%
|
1.0%
|
|
NSW Murrumbidgee GS
|
39
|
42,546
|
$105
|
3%
|
2.3%
|
|
NSW Murrumbidgee HS
|
28
|
2,536
|
$21
|
1%
|
0.7%
|
|
SA Murray HS
|
208
|
11,240
|
$84
|
3%
|
1.4%
|
|
Total
|
2,878
|
213,003
|
$812
|
4%
|
Note: The gross average returns reported above are generated using a simple method to inspect market trends, not the performance of a particular investment. See Table Notes.
4.5 Groundwater markets
Wet weather softens groundwater entitlement prices.
Groundwater entitlement prices were generally lower in 2021-22 compared to 2020-21 (Figure 18). This is typical during successive wet years because irrigators who can access surface and groundwater sources will opt for using surface water which does not incur pumping costs. When these dynamics occur, groundwater entitlement market interest and activity typically decrease.
Between 2020-21 and 2021-22, annual VWAPs for:
- Lower Lachlan Groundwater decreased by 21%, from $4,500 per ML to $3,577 per ML.
- Lower Murrumbidgee Deep Groundwater decreased by 20%, from $4,466 per ML to $3,551 per ML.
- Lower Murray Groundwater increased slightly by 3%, from $2,579 per ML to $2,646 per ML.
After reaching new highs in 2020-21, prices decreased through 2021-22 as demand for these entitlements subsided with surface water prices so low and sustained rainfall.
Despite declining prices, the volumes traded (excluding $0 trades) increased between 2020-21 and 2021-22. Lower Lachlan Groundwater had its first significant volume of trades since 2014-15.
In the Lower Murray Groundwater market, there were fewer trades in 2021-22 compared to 2020-21, although the volume transacted was much higher (up 57%). However, the volume traded in 2021-22 was still around half the volume traded during the extreme drought conditions in 2019-20.

Figure 18. Individual water entitlement trades (priced trades only, $0 trades excluded) and volumes (bubble size), major groundwater entitlement markets, 2012-13 to 2021-22.
Source: Aither, 2022. Based on New South Wales Water Register, 2022.
Note: NSW Lower Murrumbidgee Deep Groundwater Source Aquifer is an aggregate of the three zones in this aquifer. This reflects the way in which trades for these entitlements are recorded on the New South Wales Water Register. See Figure Notes.
4.6 Northern MDB markets
Entitlement prices in the northern MDB hold firm.
Northern MDB entitlement markets are generally thinly traded. This reflects their more limited hydrological connectivity and crop diversity, and the fact that most transfers are associated with land transactions. Entitlement trades in the most active northern MDB markets are shown in Figure 19.
Due to the limited number of trades, current market prices can vary significantly from VWAPs. Based on 71Q licence-to-licence transfers (which tend to be unrelated to land transfers), prices for general security entitlements in the northern Basin have been increasing over the past five years, but the increases in the last three years have been smaller than those seen between 2017-18 and 2018-19.
Between 2018-19 and 2021-22:
- NSW Lachlan GS increased 47% from $996 per ML to $1,467 per ML.
- NSW Macquarie and Cudgegong GS increased 11% from $1,658 per ML to $1,835 per ML.
- NSW Peel GS increased 1% from $1,341 per ML to $1,350 per ML.
Despite this longer term upwards trend, NSW Macquarie and Cudgegong GS was down 6% from $1,955 to $1,835 per ML.
NSW Lower Namoi GS had its first trade in three years, a single trade in 2021-22 for $3,450, which is 52% higher than the 2018-19 VWAP ($2,270). NSW Peel GS also had its first trade in two years, with one transaction at $1,350, which is the same price as the last recorded trade in 2019-20.

Figure 19.Individual water entitlement trades (priced trades only, $0 trades excluded) and volumes (bubble size) for active northern Murray-Darling Basin entitlement markets, 2012-13 to 2021-22.
Source: Aither, 2022. Based on New South Wales Water Register, 2022.
Note: Data based on 71Q licence-to-licence transfers, which tend to be unrelated to land transfers. No priced trades were recorded on the NSW Water Register for NSW Gwydir GS or NSW Lachlan HS in 2021-22. See Figure Notes.
5.1 The year in water policy and management
As was the case in 2020-21, there was little scrutiny on water markets during 2021-22. This reflects the continued wet conditions, low allocation prices, and strong commodity prices that have underpinned a successful year for many irrigation businesses.
In the absence of intense scrutiny on the functioning of water markets, from a water policy and management perspective, 2021-22 was characterised by many of the same themes from last water year, including: water market transparency, improvements to the information and data available, and strengthening metering, monitoring, and compliance.
Importantly, even with the change in the federal government, we can likely expect consistency and continuity in these areas as the new Federal Labor Government has signalled in its 5-point plan for water management in the MDB. However, the change of government has caused many to raise questions as to whether and how the new government might seek to meet the MDB Plan water recovery targets.
As we come within arm’s reach of the legislated 2024 deadline for delivery of MDB Plan commitments, there remains considerable uncertainty about what exactly will be achieved by the deadline, and what happens if the commitments are not met.
The Water Reform Roadmap paves a way forward following the ACCC’s water markets inquiry.
At the end of December 2021, the Principal Advisor released its preliminary advice on the Water Market Reform Roadmap. This Roadmap was the next step following the Australian Competition and Consumer Commission’s (ACCC) Murray-Darling Basin Water Markets Inquiry, delivered in March 2021. The Roadmap will provide an implementation plan for water market reform, with a key focus on balancing the practicality and cost-effectiveness of implementing the ACCC’s recommendations. Many of the identified actions were already in train by Basin State Governments. Five key reform actions also received in-principle support from Basin States. These reforms focused on strengthening deterrents to theft, water market transparency and education. Further details are scheduled for release in September 2022.
Progress on market information, transparency, and data.
Good quality and timely water market information is key to supporting water market participants’ decisions and market confidence. Through 2021-22, the Basin States and other government agencies continued their efforts to improve the quality and access to water markets information, including:
- The Bureau of Meteorology released their MDB Water Information Portal to provide centralised information on storages, allocations and trading information in Basin catchments.
- Victoria amended their legislation to improve water market transparency and strengthen deterrents to water theft.
- South Australia released their Final Water Security Statement. It has also scoped a number of regulatory and operational business improvements to their Water Register. These enhancements are expected to be rolled out in 2022-23.
- NSW released their first 20-year State Water Strategy, including an integrated and transparent reporting framework. NSW also continued to update and improve their Water Insights portal.
MDBA invests in tools and research to better understand the health of the Murray.
The MDB is a physical system, which is constantly evolving under changing environmental conditions and human impacts. New science and up-to-date data are needed so that river operations and water market parameters are fit-for-purpose within the changing physical and social landscape. In 2021-22, the MDBA launched a major study to investigate and assess the feasibility of options to maintain, and where possible, reinstate the capacity of the Barmah Choke. A separate project is also progressing to provide information on why developers have chosen to grow permanent horticulture downstream of the Barmah Choke. Studies have also been initiated into long-term water quality trends, and the MDBA received $66 million from the Australian Government to invest in upgrades to 24 river models.
Challenges remain on delivering MDB Plan commitments on time.
The legislated deadline of June 2024 for delivery of the 36 projects under the Sustainable Diversion Limit Adjustment Mechanism (SDLAM) looms ever closer. Completion of the SDLAM projects remains an ongoing source of contention. The NSW and Victorian Governments have stated that more time is needed beyond the June 2024 deadline to deliver the projects.
Figure 20 presents the key policy events from 2021-22. Summaries of the key events and the likely implications for water market participants are also presented.

Figure 20. Timeline of Murray-Darling Basin water policy events 2021-22.
Source: Aither, 2022.
5.2 Summary of key water policy events
Roadmap for Water Market Reform
Preliminary advice from the Advisory Panel responsible for the Water Market Reform Roadmap was delivered in December 2021. The Roadmap is a phased plan for water market reform, based on the ACCC”s recommendations from its inquiry into water markets in the MDB. The ACCC proposed 29 recommendations and 70 reform actions to improve the functioning of MDB water markets. The design of the Roadmap is focused on determining whether the ACCC’s recommendations are the most cost-effective policy responses when resources are limited, and the agreement of all Basin States is required. The final Water Market Reform Roadmap is now due by 30 September.
Implication for water market participants
Several initiatives have already been implemented (or initiated) by individual Basin States, based on the ACCC’s advice. The Roadmap identifies additional reform actions, focused on further improvements to transparency and the general functioning of water markets, coordinated across all Basin States. While the reforms have in principle support from the Basin States, implementation details still need to be agreed between the States, so it will likely be some time before changes are made.
Final decision on the Goulburn to Murray River trade rule
Following completion of the Goulburn to Murray trade review, the Victorian Government announced that the new, long-term trade rule., The new trade rule came into effect on 1 July 2022 and replaced the interim trade rule that applied in 2021-22.
The new rule allows for around 150 GL of downstream trade opportunity throughout each water year, accessible at three times: 1 July, October and December. The cap to net trade form 15 December still applies, as with the interim rule, with back trade rules also unchanged. The accompanying operating rules are largely unchanged from those followed in 2021-22.
The Goulburn to Murray trade rule review was initiated in March 2020 following environmental degradation to the lower Goulburn River because of sustained high summer flows in 2017-18 and 2018-19 created by deliveries into the lower Murray.
Implication for water market participants
Confirmation of the long-term trade rule increases certainty about the likely downstream trade opportunities out of the Goulburn in future years, and when these are likely to occur.
WaterNSW Review of the Murrumbidgee IVT application and assessment approach
In July 2021, WaterNSW commenced a review and consultation on the receipt and processing of trade applications for access to Murrumbidgee inter-valley trade capacity. The aim of the review was to identify options that could streamline the application process for water users to access Murrumbidgee inter-valley trade capacity and improve transparency for market participants.
In April 2022, WaterNSW released the findings from the consultation and announced that they were considering options to improve the transparency and predictability of the inter-valley trade application process.
Implication for water market participants
A key finding from the ACCC’s water markets inquiry was that improvements to interzone trade were required to ensure consistency for market participants wanting to access interzone trade opportunities. Introduction of an improved application and assessment approach will improve the certainty and transparency around operation of and access to Murrumbidgee inter-valley trade capacity. Improvements could also improve the efficiency of the application process.
Irrigators’ Share Distribution from GMW Connections project
On-ground works for the Goulburn-Murray Water Connections Project – the largest irrigation modernisation project in Australian history – were completed in October 2020. This project created 429 GL of water savings, of which 77 GL were distributed amongst delivery share owners in the Goulburn Murray Irrigation District.
In October 2021, irrigators with 0.25 ML/day or more of delivery share received a mix of high and low reliability water shares. For irrigators with under 0.25 ML/day delivery share, entitlements were issued to Goulburn-Murray Water and were sold in early 2022, with eligible irrigators receiving a credit to their bills in July 2022.
Implication for water market participants
Most of the new entitlements distributed were in Vic 1A Greater Goulburn, with smaller volumes in Vic 6 Murray, Vic 7 Murray, and other minor trading zones. The distribution increased the total volume of entitlement on issue in these zones available to private water market participants. This increase in supply could have placed downwards pressure on entitlement prices. At the time of writing (early August 2022), entitlement prices in these zones have either held steady or increased.
Floodplain harvesting reforms in NSW
In December 2021, the NSW Government made its third attempt to pass its floodplain harvesting reforms. These reforms are aimed at bringing floodplain harvesting in line with the MDB Plan and water sharing arrangements.
The amendments came into effect on 14 February 2022. However, they were disallowed by the NSW Parliament on 24 February 2022. Prior to the disallowance, some licences had already been issued for the NSW Border Rivers and Gwydir Valleys. These licences remain valid and are expected to be effective from 1 July 2022. The disallowance prolongs the uncertainty around the broader floodplain harvesting policy reforms.
In March 2022, a new floodplain harvesting bill was introduced by the Greens Party. The aim of this bill is to exclude floodplain harvesting licences from being eligible for compensation due to reduced water determinations or compulsory acquisition.
Implication for water market participants
The floodplain harvesting legislation is an important tool to formalise the process and requirements of the NSW Government’s floodplain harvesting policies. Licencing previously unconstrained floodplain harvesting is important to meeting the objectives of the National Water Initiative and to bring the practice into line with the MDB Plan. The continued delay to this legislation is creating ongoing uncertainty for irrigators.
Review of South Australian private carryover rules
In February 2022, the South Australian Government released their proposed changes to the private carryover policy for public consultation. The proposed changes were an outcome of a targeted consultation project in 2021 led by the South Australian Department for Environment and Water and the Murraylands and Riverland Landscape Board during which one of the key findings was that the carryover policy could be improved to better serve irrigators.
The proposed changes includde removing ‘rollover’ and forfeiture of carryover volumes and only allowing carryover to be used in the year that it is granted. SA Murray High Security (Class 3) entitlement holders will also be required to lodge an application to be eligible for carryover, rather than it being automatically granted.
Implication for water market participants
These changes will provide more certainty to market participants around access to carryover in South Australia. Entitlement holders will be able to access carryover in years that it is granted.
Update to the Murray-Darling Communities Investment Package
In 2022, the Australian Government rolled out an update to the 2020 Murray-Darling Communities Investment Package, after all items in the 2020 package were actioned. Funding from this investment package supports programs that contribute to meeting MDB Plan objectives. These programs also have a strong focus on local community and business outcomes.
The Off-Farm Efficiency Grants Program is one such program under the Investment Package. In November 2021, $150 million was made available to water delivery networks to improve the efficiency of water delivery and generate water savings. These grants were made in addition to the $1.33 billion available for state-led projects. Water savings from these projects goes towards meeting the MDB Plan water recovery targets.
Implication for water market participants
Extension of the Murray-Darling Communities Investment Package means that there is additional funding available through to 2023-24 to improve river health and economic outcomes for regional and rural communities that rely on the River Murray. Measures under this Investment Package also assist in meeting MDB Plan commitments.
Establishment of the Office of Water Compliance
The Office of the Inspector-General of Water Compliance was established in August 2021. The Office of Water Compliance combined the compliance and enforcement powers previously held by the MDBA with the assurance role of the Interim Inspector General. The Interim Inspector General role was established in 2019 to improve community confidence in the management of MDB water resources, but had no formal statutory powers.
The Office of Water Compliance is led by Hon. Troy Grant and has responsibility for compliance and enforcement of the MDB Plan, Water Act and other water resource plans. It was set up as an independent agency, with separation of powers from the MDBA and the Basin States. However, the states remain the primary and frontline managers for water compliance.
Implication for water market participants
The formalisation of the Interim Inspector General role and separation of the compliance functions from the MDBA means that there is a truly independent agency responsible for compliance in the Basin. Amendments were also made to legislation to enhance existing offences and introduce tough new penalties on water theft and insider trading. These continued efforts to improve compliance in the MDB contribute to restoring public confidence in water markets, policy and management.
6.1 Climate and rainfall outlook
A wet start to the 2021-22 water year.
The 2021-22 La Niña event which helped drive much of the wet weather in 2021-22 ended in June 2022. Despite this, rainfall outlooks continue to indicate wetter than average conditions for the MDB during the critical winter / spring period.
With 2022-23 now underway, conditions have been drier than average for this time of year (Figure 21). However, the current three-month rainfall outlook indicates that there is at least an 80% chance of rainfall exceeding the median across the majority of the MDB (Figure 22).
Bureau of Meteorology (BoM) models also suggest a 50% chance of another La Niña event forming in spring 2022. Should this happen, it will be the first time that three consecutive La Niña events have occurred since 2001.
The BoM announced on 2 August that a negative Indian Ocean Dipole (IOD) is underway and is expected to continue until late-spring. This is consistent with what happened last year when a negative IOD established in the winter-spring months. A negative IOD tends to increase the chance of above average rainfall during spring in south-eastern Australia.

Figure 21. One-month rainfall deciles, Murray-Darling Basin, July 2022 (issued 31 July 2022).
Source: Aither, 2022. Based on Bureau of Meteorology, 2022.

Figure 22. Three-month rainfall outlook (issued 28 July 2022).
Source: Aither, 2022. Based on Bureau of Meteorology, 2022.
6.2 Allocation market outlook
Consumptive water availability increases for the third year in a row.
2022-23 opening allocations were higher than in 2021-22 for major southern MDB entitlements (Figure 23).
- Vic Murray HRWS opened at 94%, an all-time high for opening allocations since unbundling.
- SA Murray HS opened at 100% for the third year in a row.
- NSW Murray GS opened at 43%, the highest opening allocation since 2012-13.
This means that approximately 1,400 GL of additional water was allocated to major entitlements held by consumptive users on 1 July 2022 (estimate 3,200 GL) compared to 1 July 2021 (estimate 1,750 GL).
While the exact volume of carryover is not published centrally, Aither estimates that 1,850 GL of consumptive carryover water was brought into 2022-23. This is 8% more than the volume that was carried over into 2021-22 (approximately 1,720 GL).
The estimated volume of carryover, plus opening season allocations, provided southern MDB consumptive users with approximately 5,000 GL of water on 1 July 2022. To put this into perspective, at the same time in 2021-22, consumptive users had access to approximately 1,550 GL less water (approximately 3,450 GL of consumptive allocations and carryover).
The volume available for consumptive purposes (including consumptive carryover) increased to approximately 5,280 GL following allocation announcements on 1 August 2022.

Figure 23. Opening allocations (1 July) made to major southern Murray-Darling Basin entitlements, 2019-20, 2020-21, 2021-22 and 2022-23.
Source: Aither, 2022. New South Wales Department of Planning, Industry and Environment, 2022; Northern Victoria Resource Manager, 2021; South Australian Department for Environment and Water, 2022.
Note: In-text estimates of the volume of water allocated and carryover volumes include zones Vic 1A Greater Goulburn, Vic 6 Murray, Vic 7 Murray, NSW Murray and NSW Murrumbidgee. See Notes and Figure Notes.
Full allocations likely before peak irrigation in most zones.
In early 2022-23, allocation prices in the lower Murray are around $85, $70 in the Murrumbidgee, $70 in the Goulburn, and $50 in the upper Murray.
As we enter 2022-23, high opening allocations, the record volume consumptive carryover, favourable winter/spring outlook, and strong commodity prices for annual crops means many irrigation businesses are set for another successful year. If at least average inflows eventuate, consumptive water availability could reach around 6,360 GL by the start of the peak irrigation season (Table 7).
This forecast is lower than the volume that was available by early December last water year (approximately 6,890 GL) because allocation outlooks to NSW Murrumbidgee GS entitlements are lower than what eventuated by peak irrigation in 2020-21. However, the timing of increases in allocations to this entitlement will be influenced by when usage begins, and airspace is created in the dams to capture new inflows. With Burrinjuck and Blowering still near capacity, the pace of increases in allocations will likely be similar to 2021-22, rather than the very quick increases in 2020-21. Overall, these dynamics across the southern connected system will keep allocation prices relatively low for another year.
Table 7. Peak irrigation season outlooks for 2022-23 based on inflow scenarios (as of 15 July 2022).
|
|
Wet - See note
|
Average - 50 per cent change of exceeding
|
Dry - 90 per cent change of exceeding
|
Extreme Dry - 90 per cent change of exceeding
|
Est. of consumptive water available (GL) - Average inflows
|
|---|---|---|---|---|---|
|
Vic 1A Goulburn HRWS
|
100%
|
100%
|
100%
|
78%
|
677
|
|
Vic 6 Murray HRWS
|
100%
|
100%
|
100%
|
100%
|
209
|
|
Vic 7 Murray HRWS
|
100%
|
100%
|
100%
|
100%
|
672
|
|
NSW Murray 10 HS
|
100%
|
100%
|
97%
|
97%
|
18
|
|
NSW Murray 10 GS
|
110%
|
110%
|
63%
|
49%
|
1,030
|
|
NSW Murray 11 HS
|
100%
|
100%
|
97%
|
97%
|
146
|
|
NSW Murray 11 GS
|
110%
|
110%
|
63%
|
49%
|
278
|
|
NSW Murrumbidgee HS
|
95%
|
95%
|
95%
|
95%
|
331
|
|
NSW Murrumbidgee GS
|
58%
|
53%
|
38%
|
38%
|
749
|
|
SA Murray HS
|
100%
|
100%
|
100%
|
100%
|
401
|
|
Total
|
|
|
|
|
4,511
|
|
Total including estimate of carryover
|
|
|
|
|
6,361
|
Note: There is some variation in the scenarios released by the state governments. The wet outlook is shown for NSW entitlements (25% chance of exceeding), and the above average outlook is shown for Victorian entitlements (30% chance of exceeding).
Note: Outlook months used to estimate the volume of water allocated by peak irrigation season are 1 November for NSW entitlements and 15 December for Victorian entitlements, as published in the respective allocation statements released on 15 July 2022.
6.3 Entitlement market outlook
Our outlook for entitlement markets remains relatively positive. A key driver of entitlement prices over the last 12 months has been liquidity. If the supply of entitlements coming to market continues to be relatively limited, prices could be pushed higher again in 2022-23.
However, given the large price increases over the last 12 months, and as macro-economic factors shift, there is uncertainty about how entitlement markets will perform in 2022-23. Interest rates and inflation have started to increase again, compounding the challenges created by rapidly rising agricultural input costs over the last 12 months. These factors, along with commodity prices and the exchange rate, could alter the investment environment for market participants.
High reliability and high security entitlement markets
This time last year, the regulatory uncertainty created by the ACCC’s water markets inquiry had just been resolved, and prices for several high security (HS) and high reliability water share (HRWS) entitlements were starting to increase again. These increases were fuelled by strong economic tailwinds and limited supply of most HS and HRWS entitlements.
These dynamics continued through 2021-22, with prices for all major entitlements in the southern MDB increasing through the year. While prices for some HS and HRWS entitlements softened slightly at the end of 2021-22, limited supply coming to market seems to be underpinning prices.
Overall, the value of these entitlements is ultimately determined by the value of the agricultural products that can be produced. Demand for Australian exports remains strong, and many irrigated agricultural sectors are enjoying very strong commodity prices, particularly cotton, rice and dairy.
Countervailing factors include rising inflation and interest rates, challenges for some irrigated agricultural sectors (particularly wine grape growers), and an increasingly long outlook for low allocation prices which will prolong the current low entitlement yield environment. Over the last 12 months, there has also been something of a stalemate in HS and HRWS lease markets with lessors unwilling to compromise on their expectations of high lease rates and relatively short lease terms. While HS and HRWS prices have held up (and increased) in this environment, how entitlement owners respond to a prolonged period of low allocation prices is a key driver to watch.
Finally, the recent change of federal government has re-ignited questions about the possibility of water entitlement buybacks to meet the MDB Plan commitments. While further water recovery from the consumptive pool has the potential to increase entitlement prices and is likely already resulting in delay or deferral of entitlement sales, the major driver of HS and HRWS entitlements prices is likely to continue to be the extent of uncovered permanent horticultural demand, especially in the lower Murray.
Low reliability and general security entitlement markets
This time last year, we anticipated that demand for low reliability water shares (LRWS) would continue, fuelled by ongoing demand for secure carryover space. We also expected that demand for general security (GS) entitlements would return given the high likelihood of full allocations to these entitlements in 2021-22. These dynamics were reflected in annual VWAPs for LRWS and GS entitlements, which reached new all-time highs in 2021-22.
At the time of writing (early August 2022), the fundamentals that drive LRWS prices (demand for secure carryover space), and GS entitlement prices (wet cycles when allocations are more likely) appear to still be in place.
Access to secure carryover space will remain an important part of many market participants’ water strategies. Given that carryover space in the lower Murray is so scarce, this demand will continue to influence prices for Vic 1A Greater Goulburn and Vic 6 Murray LRWS, as well as Vic 7 Murray LRWS. One of the key factors to watch in 2022-23, will be the high risk of spill in the Murray and any allocations to Vic Murray LRWS. A second year in a row of this entitlement receiving allocations may change market perceptions, and how this entitlement is used and valued.
Demand for GS entitlements is somewhat cyclical, with prices increasing during wet periods as these entitlements receive high (even maximum) allocations. For NSW Murray GS, there has been uncertainty about allocation increases because of the need to repay the Barmah-Millewa Forest Environmental Water Allowance. This is not the case in 2022-23, as opening allocations revealed that maximum allocations are highly likely before peak irrigation season. While allocation outlooks for NSW Murrumbidgee GS are less promising than NSW Murray GS, the large areas of annual crops that will likely be planted this year should create the necessary usage to enable maximum allocations at some point in the season. For both NSW GS entitlements, one of the key drivers that could push prices higher from current levels may be the way in which market participants view good value, particularly against recent increases in HS and HRWS prices.
6.4 Policy and regulatory influences
What is in store for the 2022-23 water year?
Two wet years and relatively low water allocation prices have kept water markets out of the policy and management spotlight. Except for a small number of water markets policy issues, 2022-23 is shaping up to be much the same. However, the completion of the Basin Plan remains the big and challenging task for federal and state governments, with several new Ministers at the helm.
The main question water market participants are asking this year is: what might the change in federal government mean for water markets, and water policy and management in the MDB?
Federal Labor’s five-point plan
In the lead up to the federal election, Labor released a five-point plan on its approach to water issues in the MDB. By and large, the headlines in the plan demonstrated a level of consistency with the approach under the Coalition Government. The consistencies include:
- Increasing compliance, metering and monitoring, which has been theme for some time and reflects the establishment of the Office for Water Compliance in late 2021. The new government has indicated it intends to support the Inspector General of Water Compliance to ensure the intended outcomes are achieved.
- Restoring transparency, integrity, and confidence, which is in line with some of the overarching messages and recommendations from the ACCC’s water markets inquiry. The new government has also emphasised that it intends to provide a full response to the ACCC’s recommendations.
- Updating the science, albeit with the notable addition to invest up to $8.5 million to commission the Commonwealth Scientific and Industrial Research Organisation to re-run the 2008 Sustainable Yield study to inform the 2026 review of the MDB Plan.
Notwithstanding Labor’s five-point plan, the new government still needs to contend with the same factors that have impeded progress on MDB water policy in recent years, including the ongoing stalemate about how to proceed with elements of Basin Plan implementation, most notably the Sustainable Diversion Limit Adjustment Mechanism.
Key developments to watch in 2022-23
- Outcomes of the next Ministerial Council meeting with several new Ministers, particularly in relation to the water recovery effort under the Basin Plan.
- Release of the phased implementation plan for water market reform due out in September 2022.
- Progress on the NSW Government’s water resource plans.
- Progress on investigations into the lower Murray deliverability risk, state government announcements on how they intend to share capacity.
- The size and timing of downstream trade opportunities from the Goulburn to the Murray with the new, long-term trade rule now in place.
References
ABARES (2022), Australian Crop Report: June 2022, Australian Bureau of Agricultural and Resource Economics and Sciences, Canberra, DOI: CC BY 4.0. Available at <https://doi.org/10.25814/04q1-sm04>.
Aither (2020) Water supply and demand in the southern Murray-Darling Basin (2020 update): An assessment of future water availability and permanent horticulture irrigation water demand. Available at <https://waterregister.vic.gov.au/about/news/321-updated-estimate-of-water-supply-and-horticulture-demand-in-the-southern-basin>
MDBA (Murray-Darling Basin Authority) (2021, 2022). End of day Barmah Choke transactions data. Available at <https://www.mdba.gov.au/managing-water/water-markets-trade/interstate-water-trade/barmah-choke-trade-balance>.
Murray Irrigation Limited (2022). Daily sales data. Available at (current water year only) <https://www.murrayirrigation.com.au/water/services/water-exchange/daily-sales-live/>
New South Wales Department of Planning and Environment (2022a). Opening Water Allocations 2022/23 – NSW Regulated River Water Sources. Available at: https://www.industry.nsw.gov.au/__data/assets/pdf_file/0005/516911/was-regulated-river-20220701.pdf
New South Wales Department of Planning and Environment (2022b). Water allocation statements. Available at <https://www.industry.nsw.gov.au/water/allocations-availability/allocations/statements>
NVRM (Northern Victoria Resource Manager) (2022). Outlook for the 2022/23 season. Available at https://nvrm.net.au/outlooks/current-outlook
VWR (Victorian Water Register) (2021). Interim Goulburn to Murray trade rules introduced from 1 July 2021. Available at <https://www.waterregister.vic.gov.au/about/news/349-interim-goulburn-to-murray-trade-rules-introduced-from-1-july-2021>
VWR (Victorian Water Register) (2022). Trade opportunities each year between zones. Available at
< https://www.waterregister.vic.gov.au/water-trading/market-insights/trade-opportunities>
About Australia’s Water Markets
Background
In Australia, there are two distinct but related water markets: entitlement markets and allocation markets.
Entitlement markets enable the trading of water entitlements. Water entitlements are ongoing rights to receive an annual share of available water resources in a consumptive pool (e.g., a river system or catchment). They are analogous to a land property right, are generally secure and mortgageable in the same way, and have substantial value. Each catchment typically has a small number of entitlement ‘classes’, and generally all entitlements within a given class are homogenous.
Allocation markets enable the buying and selling of water allocations. Water allocations are the volumes of water allocated to water entitlement holders during the water year (1 July to 30 June). They are a physical good analogous to a commodity, and are extracted from water courses and applied as inputs to production or the environment. Based on the water availability and demand at a given time, the value of water allocations per unit varies (usually expressed in $ per megalitre (ML)).
There is no single national Australian water market. Rather, there are many individual markets determined by the hydrological characteristics of physical water systems. Where hydrological connectivity exists, such as in the southern Murray-Darling Basin, trade between markets or zones is possible.
ENTITLEMENT MARKETS
Purpose, use and operation
An entitlement specifies an annual volumetric share of available water resources in a specified catchment or system. Entitlement holders receive their share of the available water resources as water allocations. Allocations vary from year-to-year based on rainfall, inflows, water held in storage and other factors. The entitlement market enables trade in the ongoing right to receive these water allocations. Entitlements can be held by virtually any party in any location.
The entitlement market is largely used by irrigated agricultural producers, but is increasingly being used by investors, water utilities (including urban suppliers) and environmental water holders. These water market participants use the market to modify their long-term arrangements for facilitating production, or meeting environmental requirements, or urban demand.
State government agencies govern the operation of entitlement markets, including rules and regulations regarding how and where trade can occur. Depending on the jurisdiction, other agencies (such as land titles or property registration agencies) will be involved. Third parties (such as exchanges, brokers and conveyancers) often play a role in facilitating entitlement trade.
Key drivers of market outcomes
The value of water entitlements is largely determined by their reliability characteristics. Reliability characteristics differ across entitlement classes. Higher reliability entitlements provide larger volumes of water allocations over the long term, and more consistently provide water allocations each year than lower reliability entitlements.
Trade in entitlements is related to longer-term production decisions and the characteristics of different irrigated agricultural enterprises, including their tolerance for risk. Producers who may be expanding or contracting production drive market activity, as do market participants who hold large portfolios of entitlements such as investors or large agricultural enterprises. Purchases of water on behalf of the environment have also driven market activity in the past.
ALLOCATION MARKET
Purpose, use and operation
The allocation market provides the ability to trade physical water between parties for use, further trade, or carryover. Allocation trade can generally only occur between parties who are in trading zones that are hydrologically connected such that water can be delivered (or substituted by other water from a shared storage).
The water allocation market is mainly used by irrigated agricultural producers (including rice, dairy, horticulture, cotton and others), and environmental water managers. Irrigators use the market to sell water excess to requirements, or buy additional water for use during dry periods or when temporarily expanding production. Environmental water holders may similarly buy or sell when they have short-term surpluses or deficits.
Similar to entitlement markets, state government regulators determine annual allocations based on entitlement characteristics (that determine priority and how much water is allocated to individuals), and market rules to manage issues such as connectivity between systems and transmission losses. State governments, either directly or via their water utilities, play a key role in facilitating allocation trade, including ensuring compliance with rules and regulations, and by approving and processing trades. Parties seeking to trade allocations may utilise intermediaries such as water exchanges and brokers.
Key drivers of market outcomes
The volume of water allocated to entitlement holders each year is a key driver of allocation market outcomes (including prices and volumes traded) because it strongly influences the total volume of water available for use or trade. When allocations are low, water is scarce and prices are high. The opposite is true when allocations are high. Allocation levels reflect broader water availability, including rainfall and inflows in relevant catchments, and volumes held in storages. Other key drivers in allocation markets include conditions in markets for irrigated agricultural products, and conditions in substitute input markets.
Download Water Markets Report Notes
State water register trade data and volume weighted average prices
Data cleaning method
Irrigation corporation trade data
Carryover estimates
Entitlement on issue data
Rounding errors
Aither Entitlement Index
Table notes
Figure notes