Background
Australian water management has undergone a significant period of reform over the past three decades. The establishment of water markets has been a key component of this reform story.
Water markets are now an established part of agricultural, urban and environmental water policy, management and investment in Australia.
The Aither Water Markets Report provides an overview of current water market activity in the southern Murray–Darling Basin, compares market outcomes with recent years and comments on the future outlook.
Download the PDF here

About Aither
Aither works with businesses, governments and industry groups to enable improved decision making that reflects the value of scarce water resources. Our understanding of the value of water underpins our economics, policy and commercial advisory services in water markets, resources, infrastructure and risk.
Our specialist water markets services include:
- design and analysis of water market policy
- transaction advisory and investment due diligence
- portfolio strategy, optimisation and performance
- water asset valuation services
- using custom-designed water management frameworks and market modelling tools
Aither’s water markets team works with Australian and international clients who require high-quality information, insights and analysis to make better decisions and achieve improved outcomes. With an expert team of water economists, strategists, and policy and performance advisers, Aither provides the best available water sector advice.
If you would like to find out more about this report or have any feedback, please get in touch.
Executive Summary
Facts at a glance – 2018-19
- Estimated value of commercial allocation trade: $566 million (three-fold increase on 2017-18 value)
- Annual average southern MDB allocation price: $375 to $460 per ML
- Estimated value of total southern MDB entitlement on issue: $22.7 billion
- Aither Entitlement Index (AEI) 30 June 2019: 223.77 points (up 24 per cent over 12 months)
- Value of total entitlement transfers:
$699 million - Total volume of entitlement transfers (outside of irrigation corporations): 237 GL (up 48 per cent on 2017-18)
- Entitlement market turnover: 4 per cent
- Average annual entitlement returns (sale of allocations): ~5 per cent
Summary of 2018-19
2018-19 will be remembered as a year when widespread dry conditions collided with strong and growing water demand to significantly increase water prices.
Allocation prices in the southern Murray–Darling Basin (MDB) are now being sustained at levels that were only observed briefly in the Millennium Drought. During the 2018-19 water year, average monthly allocation prices increased from approximately $230 per ML (July 2018) to above $550 per ML (June 2019). Likewise, entitlement prices increased for the sixth consecutive year.
Multiple demand side factors drove prices upwards. For example, dry conditions prompted winter croppers to enter the market early in the year to finish off their crops. Murrumbidgee irrigators committed to large areas of cotton and some were caught out by the lack of allocations to their entitlements, resulting in them also needing to enter the allocation market to finish off their crops. Ongoing investment in new almond developments (and other permanent horticulture) in the lower Murray also played a significant role in driving demand. Conversely, rice growers were priced out of the market almost entirely and dairy farmers endured a tough year with unfavourable milk prices and high water and fodder costs driving production down, resulting in some farm business exits.
Allocation market
- Climatic conditions (below average rainfall) and water availability (lower allocation volumes than 2017-18) were major drivers of allocation prices.
- Prices increased steadily throughout the year, exceeding what would previously have been expected given the volumes of consumptive water available. This suggests that significant structural change in demand is taking place.
- Water prices in the Murrumbidgee peaked at approximately $700 per ML in January 2019. This was driven by unexpectedly poor summer growing conditions and inflexible water demand from cotton growers that had already committed to their crops.
Entitlement market
- The Aither Entitlement Index (which tracks the relative performance of a group of major water entitlement types across the southern MDB) reached a new record high of 224 in June 2019, up 24 per cent from 181 in June 2018.
- Strong commodity prices for almonds, citrus and grapes are driving sustained investment in these industries. Consequently, demand for high reliability water entitlements is increasing.
- Towards the end of the season, high allocation prices and concerns about water availability and price drove some horticulturalists to buy entitlements as a way of securing long term supply. Some irrigators also appeared to be turning to groundwater, with notable price increases in some systems.
Facts at a glance – Outlook
- Comparison of 2019-20 and 2018-19 opening season allocations to consumptive users (excluding carryover): 1,300 GL less water allocated than at opening of 2018-19
- Estimated 2019-20 total end-of-season volume of water available to southern MDB consumptive users under dry scenario (including carryover): 2,200 to 3,000 GL
- Current three-month rainfall and inflow outlook for southern MDB: Drier than average
- Current southern MDB allocation prices:
$550 to $630 per ML – highest prices since the Millennium Drought - Aither’s modelled estimate of 2019-20 average annual southern MDB allocation price (dry and extreme dry scenarios): $425 to $590 per ML
Outlook for 2019-20 and beyond
Allocation market
- Aither expects allocation prices to remain high.
- Based on climate outlooks, widespread dry conditions and low rainfall are expected to persist through the first half of 2019-20.
- Despite some recent rain, inflows remain low. In combination with favourable commodity prices in many industries, this will sustain high prices for 2019-20.
- Horticulturalists will be thinking about the year ahead and moving to secure water for their permanent plantings.
- A big reduction in the cotton crop is expected, unless high inflows return to the Murrumbidgee before October 2019.
- With trade constraints binding, prices in the Lower Murray are expected to be the highest of all trading zones and, potentially, a large price differential could emerge with upstream trading zones (particularly the Goulburn).
- If the Goulburn IVT remains closed, some dairy farmers and fodder producers that do not hold entitlement to meet all their needs may benefit from lower allocation prices as well as higher milk prices, and potentially increased availability of fodder and hay.
Entitlement market
- Aither expects that demand for high reliability entitlement types will remain strong across the southern MDB.
- Entitlement demand will continue to be driven by favourable commodity prices for almonds, table grapes and citrus, combined with the reluctance of most entitlement owners to sell.
- We expect trade restrictions will continue to drive price differentials across entitlement types. High allocation prices in the Lower Murray region will likely continue to place upward pressure on entitlement prices in this zone. This is already being observed in early trading in 2019-20.
- Market participants may be forced to reconsider the value of NSW Murray General Security as well as Goulburn HRWS and Upper Murray entitlements if allocations remain low and trade restrictions continue to bind, resulting in lower returns.
1.1 Introduction
The Aither Water Markets Report is now in its sixth year.
The report provides water market participants, advisors, investors and policy professionals with an up-to-date and accessible overview of recent water market drivers and activity in the southern Murray–Darling Basin (MDB) (Figure 1).
The Aither Water Markets Report 2018-19 highlights the unfolding story of intensifying dry conditions and reduced water available for consumptive users, combined with structural changes in water demand.
Our review of 2018-19 shows that the combination of these structural demand changes, climate change and cyclical conditions is having a significant influence on both entitlement and allocation market prices. Our outlook for 2019-20 explores how these factors may play out over the course of the year ahead.

Figure 1. Southern Murray-Darling Basin Water Trade Zones
Source: Aither, 2019.
2.1 Climatic Conditions
2.1.1 Persisting dry conditions
2018-19 was another dry year across the MDB. Rainfall was either below or very much below average for most of the MDB (Figure 2).
A key driver of reduced rainfall in 2018-19 was a positive Indian Ocean Dipole (IOD) which tends to shift rainfall patterns, and results in lower rainfall across south-east Australia.
The northern MDB was particularly dry with parts of the Border Rivers region observing the lowest rainfall on record. Rainfall conditions in the southern MDB tended to be better, although many regions recorded average to very much below average rainfall.
These climate dynamics have intensified the drought conditions across the MDB following a similarly dry 2017-18 (Figure 3).

Figure 2. Rainfall deciles, 1 July 2018 to 30 June 2019
Source: Aither, 2019. Based on Bureau of Meteorology, 2019
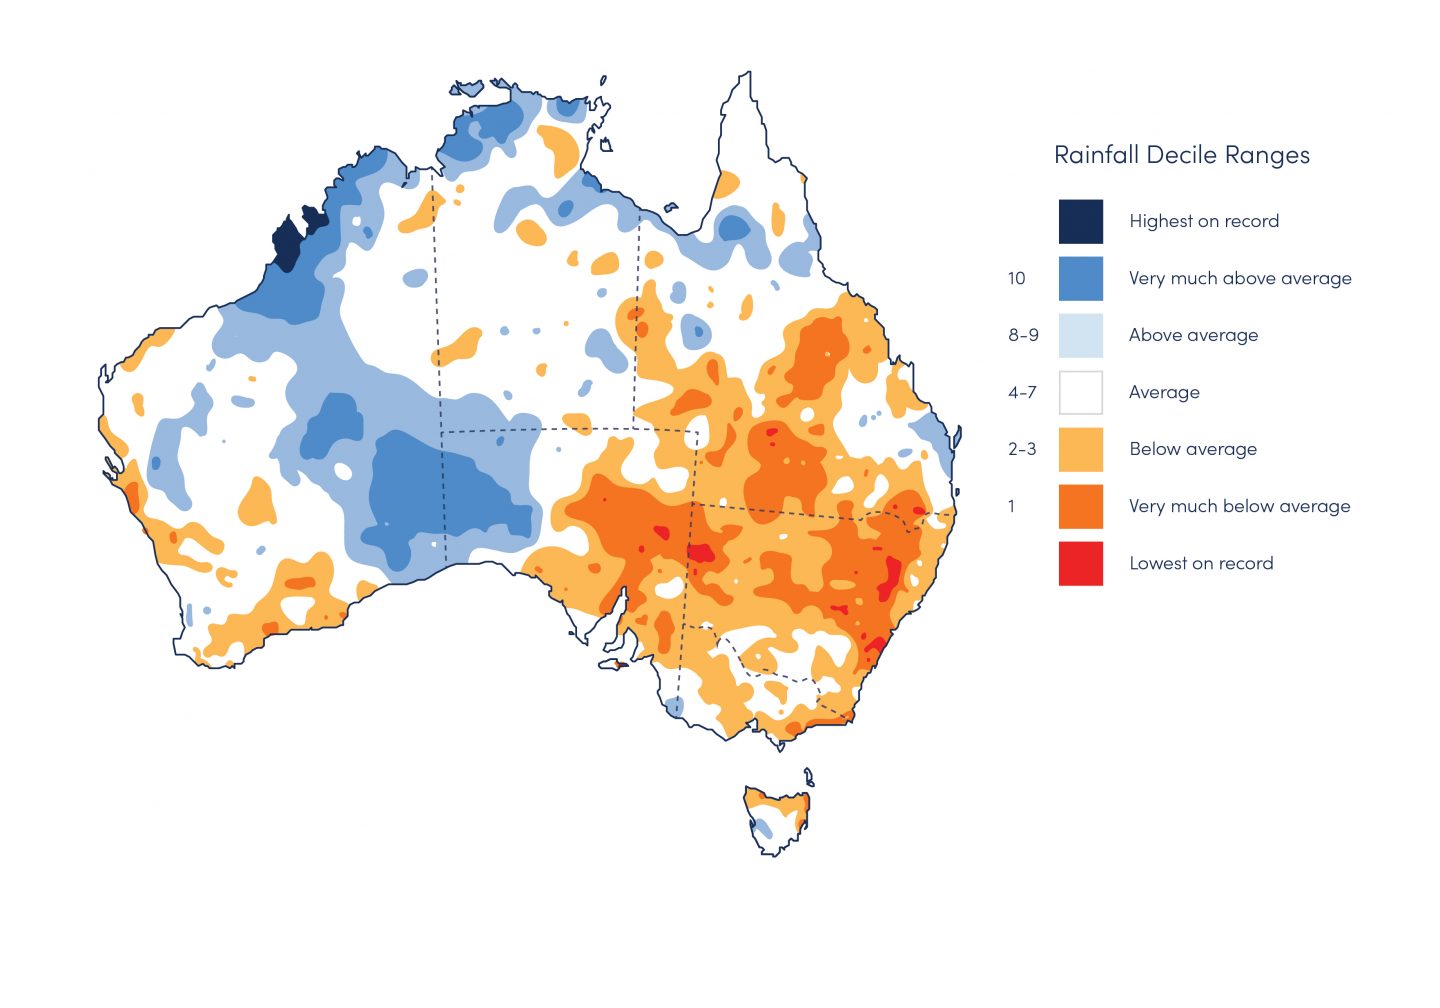
Figure 3. Rainfall deciles, 1 July 2017 to 30 June 2018
Source: Aither, 2019. Based on Bureau of Meteorology, 2019
2.1.2 Below average and inconsistent on-farm rainfall
Below average rainfall across the MDB was reflected in below average on-farm rainfall throughout may irrigation regions in the southern MDB.
Figure 4 shows that during the first three months of 2018-19, many growing regions received below average rainfall. This resulted in strong early season demand for irrigation allocations by winter crop growers.
The dryland drought conditions increased fodder prices which meant that it became cost prohibitive for dairy farmers to purchase fodder instead of irrigating.
There was also limited rainfall over the summer in many key irrigation regions which further increased irrigation demand from permanent horticulturalists and those summer croppers that were able to plant in 2018-19.
2.2 Storage and Allocations
2.2.1 Declining storage levels
Persistent dry conditions, combined with high levels of water use, have resulted in a significant reduction in water held in the major southern MDB headwater storages. Storage levels have fallen from 63 per cent in July 2018 to 42 per cent in July 2019.
This decline continues the downward trend since late 2016. Storage levels are now at some of the lowest levels experienced since the Millennium Drought (Figure 5).
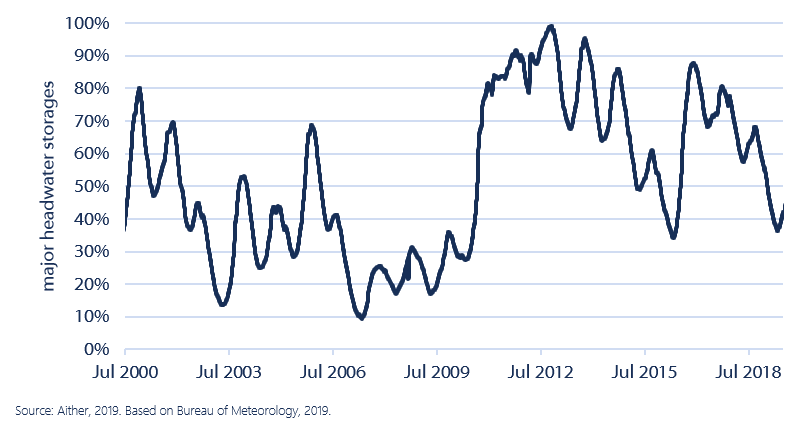
Figure 5. Major headwater storages, southern Murray–Darling Basin, 1 July 2000 to 30 June 2019
2.2.2 Lower total allocations than 2017-18
Across the southern MDB, approximately 3,326 GL was allocated to water entitlements, which is the lowest total volume allocated since 2008-09 (Figure 6).
Total allocations in 2018-19 also continued a downward trend in water availability over the last three water years. Allocations were 33 per cent less than in 2017-18, and 51 percent less than in 2016-17 (Figure 6).
Figure 6 also shows the volume of water allocated to entitlements purchased by the Commonwealth Government through buybacks which are no longer available for consumptive use. In 2018-19, this was approximately 17 per cent of total water allocated.
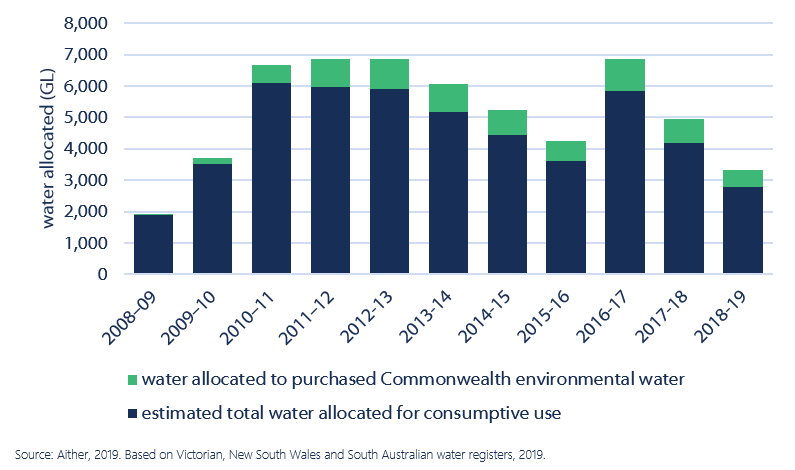
Figure 6. Estimated total volume of water allocated to consumptive use and Commonwealth environmental water in the southern Murray-Darling Basin, 2008-09 to 2018-19
2.2.3 Lower total opening allocations across the MDB
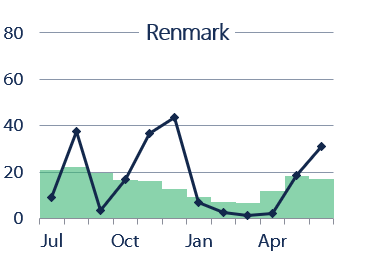
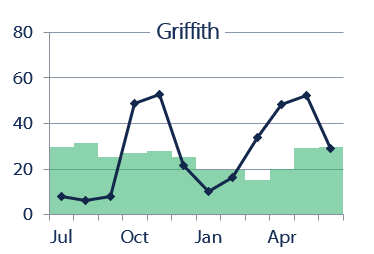
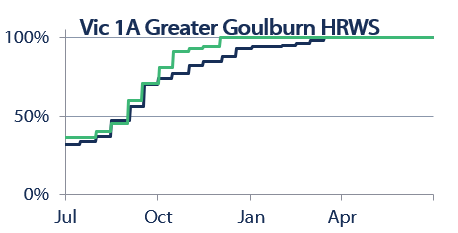
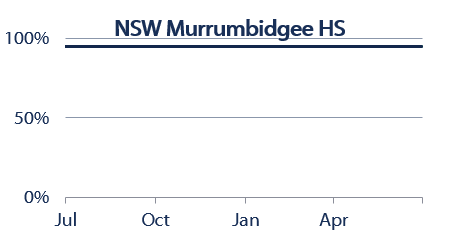
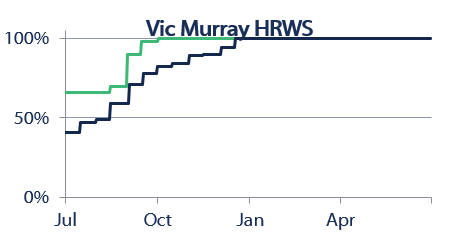
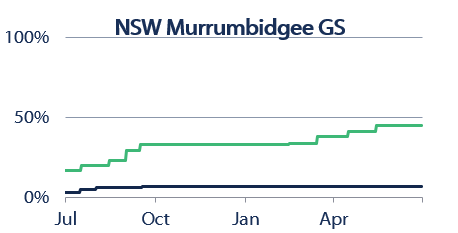
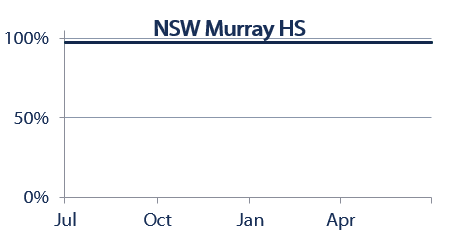
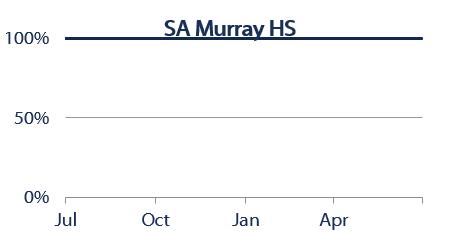
Opening water allocations to many major southern MDB entitlement types were also lower in 2018-19 than in 2017-18 (Figure 7). While in some cases, allocations eventually reached 100 per cent (equal to 2017-18), delayed allocations meant that users were more likely to turn to the allocation market at the beginning of the season to secure water, rather than wait for allocations to their entitlements.
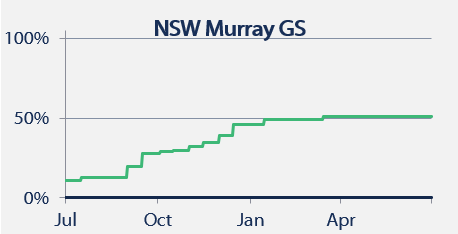
Notably, NSW Murray General Security allocations remained at zero per cent for the whole year leaving many holders of these entitlements disappointed.
2.3 Demand for Water
2.3.1 Increasing demand from permanent horticulture
Since 2010-11, irrigated cotton growing has emerged in the southern MDB. As the industry has grown, increased volumes of water have shifted towards cotton, and away from other summer crops, such as rice in the NSW Riverina (ABS, 2018).
A similar story is emerging for permanent horticulture. Recent research by Aither (commissioned by the Victorian Government Department of Environment, Land, Water and Planning) has examined the changing balance of water supply and demand in the southern MDB. Using multiple data sources, we established a more accurate and current estimate of the total volume of horticultural water demand in the connected Murray and Goulburn systems. This estimate is based on existing and planned plantings and orchard maturation trajectories.
While the exact figures remain difficult to confirm, our results show that permanent horticultural crop demands in the southern MDB are higher than previous estimates. This demand will continue to grow as existing plantings mature and new developments proceed across the southern MDB.
Our assessment suggests that there is potentially demand for approximately 1,400 GL per annum in the connected Murray and Goulburn, and potential for approximately 160 GL of additional demand if developments in various stages of planning eventuate.
As a result, in extreme dry conditions in the future (similar to 2007-08), the volume of water allocated across the connected Murray and Goulburn systems may be only slightly higher than the water demand attributable to existing plantings, excluding the effects of carryover, trade constraints and market behaviour (Figure 8).
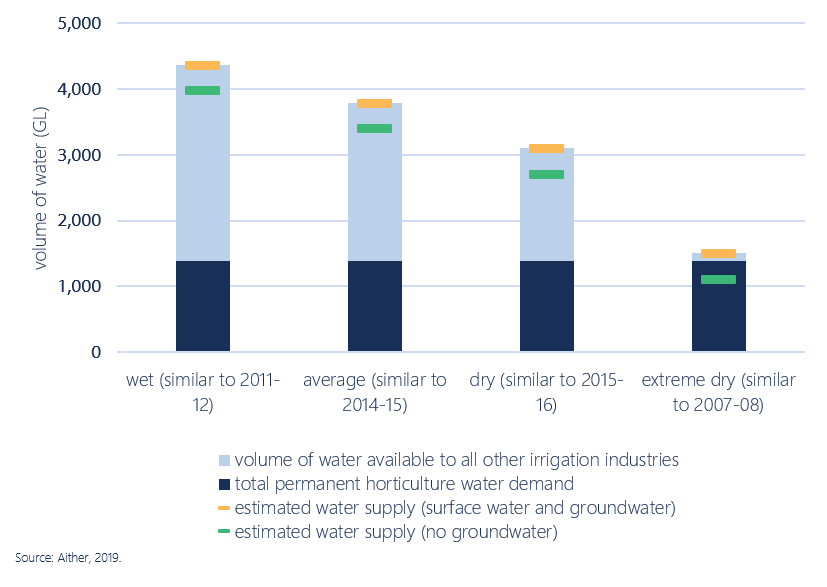
Figure 8.Water availability scenarios and baseline permanent horticulture water demand (at full maturity), southern MDB (excluding Murrumbidgee)
2.4 Implications for the Market
2.4.1 Market prices are deviating from historical trends
Persistent and intensifying dry conditions that reduce water availability and changing patterns of water demand are combining to reshape the historical relationship between water allocations and water prices.
Figure 9 presents the last 11 water years ordered from lowest to highest volume-weighted average price (VWAP). This shows that, in general, as the volume of water allocated to entitlements increases, market prices decrease.
However, this relationship shifted considerably in 2018-19. Average prices in 2018-19 were the highest on record, while water allocations were not at the lowest on record. Despite almost 900 GL of additional water being allocated for consumptive use in 2018-19 compared to 2008-09, average allocation prices were 38 per cent higher. This suggests that significant structural change in demand is taking place.

Figure 9. Water allocated and average annual volume-weighted average prices, 2008-09 to 2018-19
3.1 The Year in Water Policy and Management
2018-19 was a tumultuous year for water policy and management in the MDB.
Following mounting unease with the implementation of some elements of the MDB Plan, significant inter-governmental agreement was reached at the MDB Ministerial Council (MinCo) meeting in December 2018.
However, the fish death events in the Lower Darling and release of the South Australian Royal Commissioner’s report in January 2019 threw Basin water policy and management into the public spotlight during the New South Wales state and the federal election campaigns.
While governments are still working together to refine implementation of the Plan, polarised views persist throughout Basin communities and the Australian public. Amongst other initiatives, these ongoing concerns have prompted the Australian Government to announce two important inquiries: an independent panel to assess the social and economic conditions of irrigated communities across the MDB and the ACCC Inquiry into markets for tradeable water rights.
Figure 10 presents a timeline of key water policy events across the MDB during 2018-19.

Figure 10. Timeline of Murray-Darling Basin water policy events, 2018-19
3.2 Summary of Key Water Policy Events
Barmah Choke Bypass through Mulwala Canal
August, 2018
WaterNSW and Murray Irrigation agreed to allow water through the Mulwala canal, bypassing the Barmah Choke (for 2018-19 only). This was designed to improve peak deliverability downstream to the Lower Murray. It was a one-year agreement and it is unclear if it will be extended.
MINCO Deal to complete MDB Plan
14 December, 2018
The MDB Ministerial Council reached a long-awaited agreement on the socio-economic criteria for the 450 GL of additional water recovery under the Plan, as well as a range of other key matters.
Productivity Commission’s five-year Basin Assessment
25 January, 2019
The Productivity Commission (PC) released its five-yearly assessment of the effectiveness of the Basin Plan implementation. The PC found that Basin states have made significant progress in implementing key elements of the Basin Plan, however further work is required to achieve its full implementation.
South Australian Murray-Darling Basin Royal Commission
31 January, 2018
The South Australian Government released the findings of the state’s MDB Royal Commission. The Commissioner’s scathing recommendations included: reassessing the sustainable diversion limits (SDL) and the volumes required for further water recovery efforts; full disclosure of all previous modelling, assumptions and other parameters used to develop the Plan; improved monitoring, metering and compliance actions; and enhanced rights for Traditional Owners.
Foreign Ownership Register released
1 March, 2019
The Australian Government released the first report of the Register of Foreign Ownership of Water Entitlements. It showed that approximately 10 per cent of Australian water entitlements have some level of foreign ownership. The largest volume of foreign owned water entitlements is in Western Australia (26 per cent), followed by Queensland (18 per cent) and New South Wales (9 per cent). The level of foreign ownership of MDB water entitlements (approximately 9 per cent) is slightly lower than the level of foreign ownership of all Australian water entitlements.
Independent Fish Death Assessment released
10 April, 2019
Large-scale fish deaths in several NSW rivers and storages attracted significant media attention in December 2018 and January 2019. The Federal Government and Federal Opposition established separate independent panels to investigate and propose remedial actions. The final report of the Government-appointed panel — chaired by Aither Senior Associate Robert Vertessy — stated that the fish deaths were caused by a combination of low flows, poor water quality and a sudden change in temperature, causing the weir pools to suddenly de-stratify resulting in low oxygen levels. The panel further noted that there were several other contributing factors, including climate conditions, hydrology and water management, such as the operation of the Menindee Lakes system.
Independent panel to investigate socio-economic conditions in irrigated communities announced
8 April 2019
The Australian Government announced the establishment of an independent panel to undertake an assessment of social and economic conditions in irrigated communities across the MDB.
MDBA Releases Investigation on Price Reporting
31 May 2019
The MDBA released the findings of its investigation into reporting of water trading. The key finding was that complete and accurate consolidated reporting is impossible due to an absence of robust arrangements across Basin governments to gather comprehensive price information
Following the start of the 2019-20 water year:
Victoria slows irrigation growth below the Barmah Choke
11 July, 2019
The Victorian Water Minister, Lisa Neville, announced that no new licences for water extraction in the Victorian Lower Murray will be issued, nor extraction limit increases be granted, unless it can be shown that there will be no increased risks to the environment or entitlement holders. The announcement followed heightened concern about the deliverability of water to downstream water holders and environmental impacts. Minister Neville requested that New South Wales and South Australia put in place similar arrangements.
ACCC Inquiry Announced
7 August, 2019
The Australian Government has directed the ACCC to conduct an inquiry into markets for tradeable water rights in the MDB. The Inquiry will span the operations, transparency, regulation, competitiveness and efficiency of markets for tradeable water rights. The ACCC’s interim report is due 31 March 2020, with the final report completed by 30 November 2020.
4.1 Allocation Trade Prices
Annual water allocation VWAPs rose rapidly across 2018-19 — in some cases more than tripling 2017-18 prices (Table 1). 2018-19 average prices diverged across the southern MDB zones – from approx. $375 per ML in the Greater Goulburn to approx. $465 per ML in the Victorian Lower Murray – with the price difference being driven by trade constraints.
For example, the lower VWAP in the Greater Goulburn reflects the inter-valley trade limit (IVT) being in effect throughout much of the year, limiting trade to the Murray where higher prices were obtainable.
The estimated total value of commercial (as opposed to ‘non-commercial’ or related party) allocation trade in the southern MDB for 2018-19 was $566 million, tripling the 2017-18 estimate of $189 million.
This estimate uses allocation transfers reported at $0 per ML as a proxy for non-commercial transfers. This approach may understate the total value of commercial trade because known trade disclosure issues result in the reporting of some commercial allocation trades at $0.
Table 1. Annual volume-weighted average allocation prices, major Southern Murray-Darling Basin zones, 2015-16 to 2017-18
|
Trading zone
|
VWAP 2016-17 ($/ML)
|
VWAP 2017-18 ($/ML)
|
VWAP 2018-19 ($/ML)
|
Change in price 2017-18 to 2018-19 (%)
|
|---|---|---|---|---|
|
Vic 1A Greater Goulburn
|
$47
|
$99
|
$374
|
276%
|
|
Vic 6 Murray (Dart to Barmah)
|
$47
|
$115
|
$415
|
261%
|
|
Vic 7 Murray (Barmah to SA)
|
$47
|
$137
|
$463
|
238%
|
|
NSW Murray
|
$47
|
$127
|
$412
|
226%
|
|
NSW Murrumbidgee
|
$27
|
$138
|
$404
|
192%
|
|
SA Murray
|
$58
|
$152
|
$431
|
183%
|
4.2 Allocation Trade Activity
Table 2 shows total 2018-19 allocation transfers across major southern MDB zones. The analysis suggests Vic 7 Murray was a very large net exporter of water allocations, while the SA Murray was a major recipient of transferred water.
However, as noted earlier in this report, separating commercial transfers from non-commercial transfers is important to achieve an accurate picture of the market. Based on current public reporting practices of most state governments, it remains difficult to identify or categorise types of transfers.
When Aither adjusted for transfers reported at $0 per ML (a proxy for non-commercial transfers), a different picture emerged. Table 3 repeats the analysis presented in Table 2, but removes transfers reported at $0.
This approach shows that water allocations were commercially traded downstream along the Murray, revealing the lower Victorian Murray to be a net importer of water. As noted earlier in this report, the increasing water demand from permanent horticulture in the Lower Murray is increasingly driving water demand, especially during current dry conditions.
Table 2. Allocation transfer numbers and volumes, major Southern Murray-Darling Basin zones (all reported transfers), 2018-19
|
Trading Zone
|
Within
|
Into
|
Out of
|
Net Change (ML)
|
|||||||||
|---|---|---|---|---|---|---|---|---|---|---|---|---|---|
|
Vic 1A Greater Goulburn
|
6,084
|
620,701
|
1,419
|
128,134
|
2,403
|
255,663
|
-127,529
|
||||||
|
Vic 6 Murray (Dart to Barmah)
|
753
|
105,829
|
516
|
46,204
|
1,174
|
152,570
|
-106,366
|
||||||
|
Vic 7 Murray (Barmah to SA)
|
5,713
|
541,591
|
3,504
|
459,754
|
1,474
|
813,732
|
-353,978
|
||||||
|
NSW Murray
|
1,346
|
226,709
|
938
|
172,679
|
335
|
80,921
|
91,758
|
||||||
|
NSW Murrumbidgee
|
1,092
|
314,695
|
28
|
10,220
|
256
|
54,985
|
-44,765
|
||||||
|
SA Murray
|
789
|
224,890
|
560
|
663,416
|
417
|
130,302
|
533,114
|
||||||
|
TOTAL
|
15,777
|
2,034,415
|
6,965
|
1,480,407
|
6,059
|
1,488,173
|
|||||||
Table 3. Allocation transfer numbers and volumes, major Southern Murray-Darling Basin zones (excluding $0 transfers), 2018-19
|
Trading zone
|
Within
|
Into
|
Out of
|
Net change (ML)
|
|||||||||
|---|---|---|---|---|---|---|---|---|---|---|---|---|---|
|
Vic 1A Greater Goulburn
|
4,235
|
275,633
|
1,085
|
52,784
|
1,983
|
96,212
|
-43,428
|
||||||
|
Vic 6 Murray (Dart to Barmah)
|
454
|
16,159
|
388
|
19,178
|
965
|
69,088
|
-49,910
|
||||||
|
Vic 7 Murray (Barmah to SA)
|
4,170
|
330,316
|
2,899
|
191,431
|
1,135
|
117,478
|
73,953
|
||||||
|
NSW Murray
|
842
|
83,135
|
750
|
87,306
|
218
|
31,473
|
55,833
|
||||||
|
NSW Murrumbidgee
|
827
|
155,523
|
13
|
2,572
|
215
|
26,821
|
-24,249
|
||||||
|
SA Murray
|
403
|
56,198
|
445
|
67,594
|
354
|
53,201
|
14,393
|
||||||
|
TOTAL
|
10,931
|
916,964
|
5,580
|
420,864
|
4,870
|
394,273
|
|||||||
4.3 Comparison of Trade Prices and Volumes
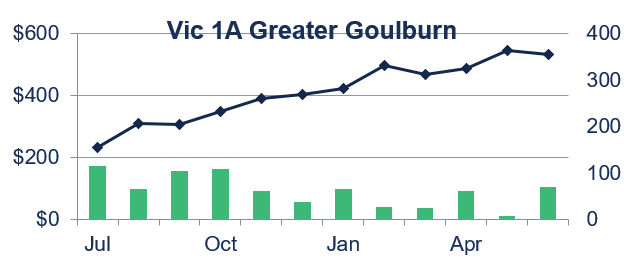
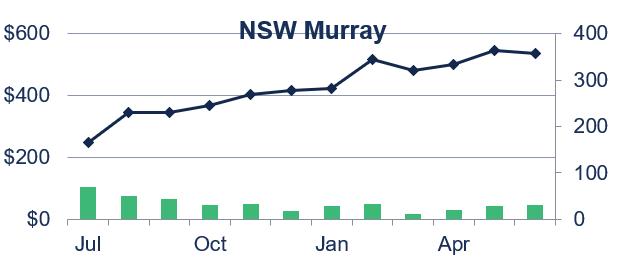
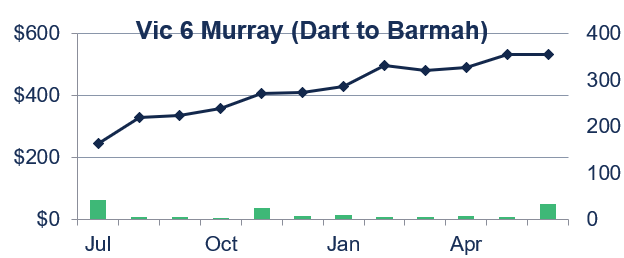
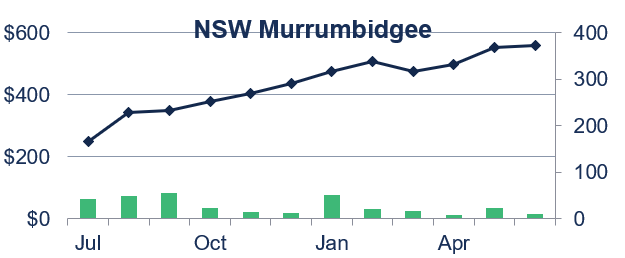
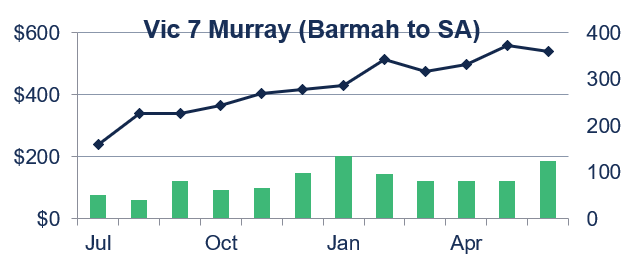
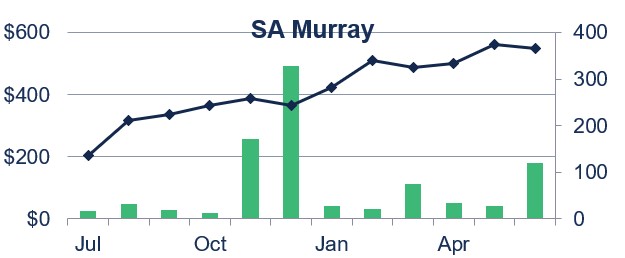
Average southern MDB allocation prices started the 2018-19 water year at approximately $230 per ML (Figure 11). Average monthly prices closed the year at an annual high of approx. $560 per ML in the Murrumbidgee and $530 per ML elsewhere. Price appreciation in the latter half of the year followed drying conditions and a poor outlook for 2019-20.
For the majority of 2018-19, water allocations in the Murrumbidgee traded at a price premium to the Murray — based on a substantial area planted with cotton. This price premium peaked at 11 per cent in January 2019, when there was an unexpected period of dry weather and substantial volumes were traded in a short period (Figure 12). In particular, cotton growers had planted relatively large areas, had obligations to fulfil contracts and had budgeted for greater improvements in water allocations.
Historically, the NSW Murrumbidgee typically trades at a discount to the rest of the southern MDB, and is a net exporter of water. However in the last two years, the direction of trade has reversed, due to:
- the substantial cotton and corn crops planted in the Murrumbidgee,
- restriction of transfers into the Murrumbidgee, and
- growers’ willingness to pay a premium in order to secure water.
This trade reversal and the imposition of the trade restriction drives the price premium in the months in which it applies.
In contrast, Vic 1A Greater Goulburn allocations traded at a price discount to the Murray throughout 2018-19. This discount reached a maximum of 10 per cent in September 2018. This discount similarly represents a break in the historical price trend for Vic 1A Greater Goulburn. This discount is being driven by restrictions on water allocations trading out of the Goulburn,
stemming from increased water demand in the rest of the southern MDB and relatively lower demand for water at such high prices in the Goulburn.
A detailed breakdown of VWAP and volumes transferred by reported trade zone is included in Figure 13.

Fig 11. Monthly volume-weighted average allocation prices major southern Murray-Darling Basin zones, 2018-19
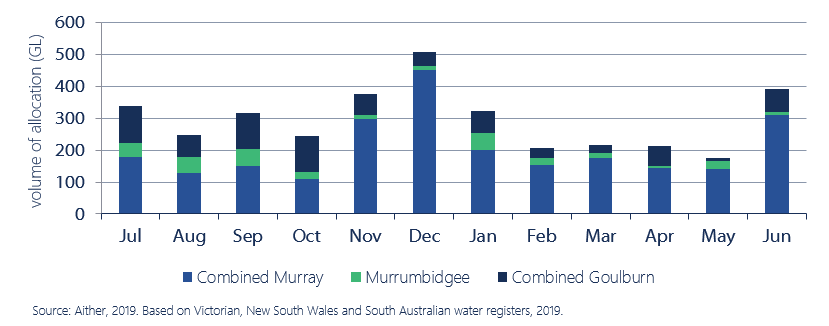
Fig 12. Monthly transfer volumes, major southern Murray-Darling Basin zones, 2018-19
5.1 Entitlement Trade Activity and Prices
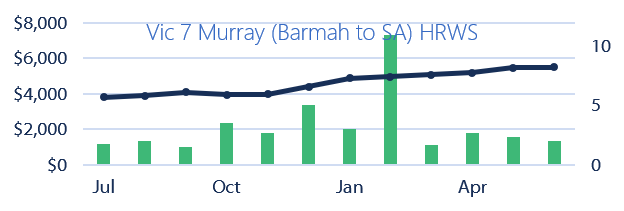
For the 11 major water entitlements covered in this report, there was approximately 237 GL transferred between market participants in 2018-19 (Table 4) – which is approximately 48 per cent more than 2017-18. By volume, the most actively traded entitlements in 2018-19 were Vic 7 Murray (Barmah to SA) HRWS and Vic 1A Greater Goulburn HRWS.
The analysis presented in Table 4 does not include transfers that are reported ‘within’ New South Wales irrigation corporation licences. We have excluded these transfers as they are not reported on the New South Wales water register and when they are reported through the Bureau of Meteorology, they are done so without prices.
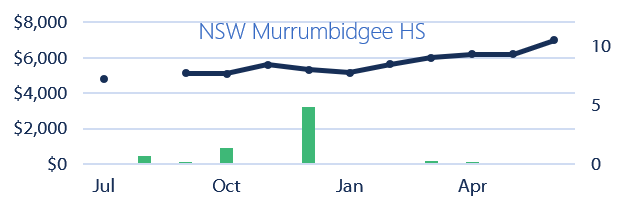
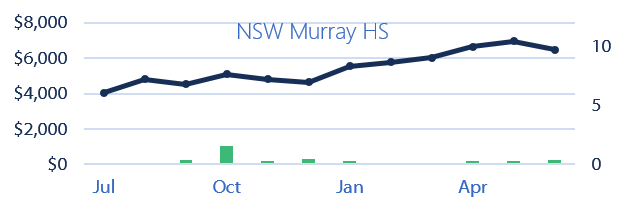
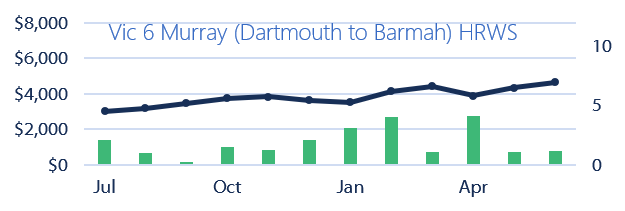
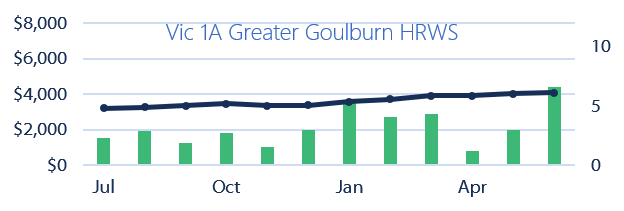
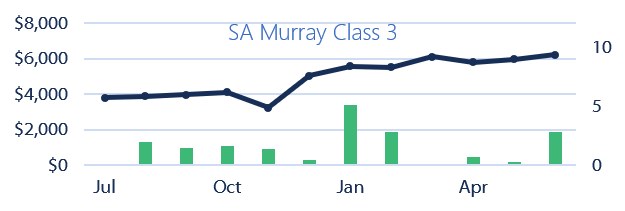
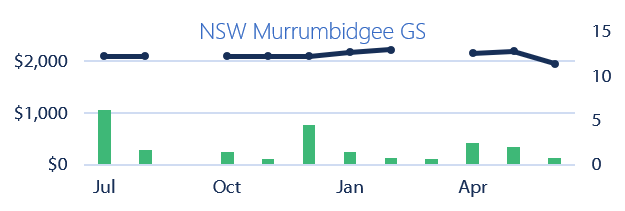
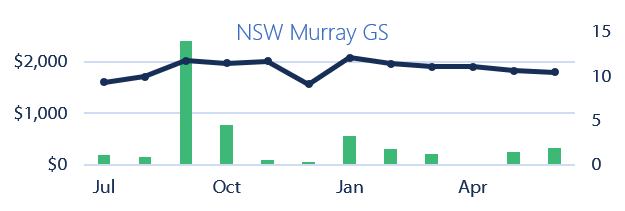
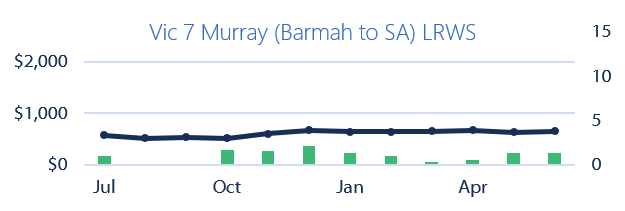
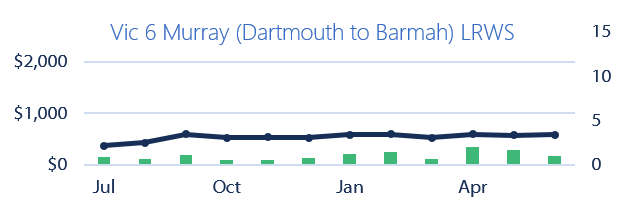
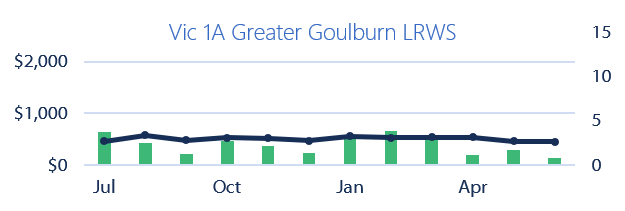
Water entitlement prices increased significantly during 2018-19. All higher reliability, and most lower reliability entitlement types (notably excluding NSW General Security entitlements), experienced an increase in monthly VWAP (Figure 15, Figure 16). The most significant price increase was for Vic 7 Murray (Barmah to SA) LRWS, increasing 61 per cent from 2017-18 (Figure 16). This reflects the expansion of permanent plantings in the region and demand for carryover.
Table 4. Annual transfer volumes and volume-weighted average prices, major Southern Murray-Darling Basin entitlement types, 2017-18 and 2018-19
|
Entitlement type
|
No.
|
Volume (ML)
|
Annual VWAP ($/ML)
|
Annual change in price (%)
|
Three-year change in price (%)
|
|||
|---|---|---|---|---|---|---|---|---|
|
Vic 1A Greater Goulburn HRWS
|
845
|
38,647
|
$2,792
|
$3,628
|
30%
|
41%
|
||
|
Vic 1A Greater Goulburn LRWS
|
348
|
27,281
|
$366
|
$517
|
41%
|
75%
|
||
|
Vic 6 Murray (above Choke) HRWS
|
272
|
22,847
|
$2,865
|
$3,830
|
34%
|
47%
|
||
|
Vic 6 Murray (above Choke) LRWS
|
142
|
12,516
|
$375
|
$558
|
49%
|
99%
|
||
|
Vic 7 Murray (below Choke) HRWS
|
961
|
39,416
|
$3,249
|
$4,530
|
39%
|
56%
|
||
|
Vic 7 Murray (below Choke) LRWS
|
191
|
12,259
|
$386
|
$620
|
61%
|
115%
|
||
|
NSW Murray HS
|
63
|
4,082
|
$3,892
|
$5,740
|
47%
|
70%
|
||
|
NSW Murray GS
|
75
|
30,944
|
$1,362
|
$1,964
|
44%
|
62%
|
||
|
NSW Murrumbidgee HS
|
25
|
7,994
|
$3,743
|
$5,762
|
54%
|
62%
|
||
|
NSW Murrumbidgee GS
|
44
|
22,383
|
$1,664
|
$2,139
|
25%
|
46%
|
||
|
SA Murray HS
|
165
|
18,710
|
$3,039
|
$4,578
|
51%
|
62%
|
||
|
TOTAL
|
3,131
|
237,078
|
||||||
5.2 Aither Entitlement Index
The Aither southern MDB Entitlement Index (AEI) tracks the relative performance of a group of major water entitlement types across the southern MDB, providing a simple overall snapshot of how major water entitlements are performing (Figure 14).
The AEI is updated monthly and is freely available at Aither’s website, so that irrigators, investors, banks, and owners of water can benchmark the capital value performance of their water portfolios over time.
Across the 2018-19 water year, the AEI increased by 24 per cent and gained in almost every month, excluding March.
Over the past five years, an 11 per cent Compound Annual Growth Rate (CAGR) has been observed through the AEI. Since inception of the AEI (11 years ago), an eight per cent CAGR has been observed.
A detailed breakdown of VWAP and volumes transferred by reported entitlement type for high reliability is included in Figure 15, and for low reliability is included in Figure 16.
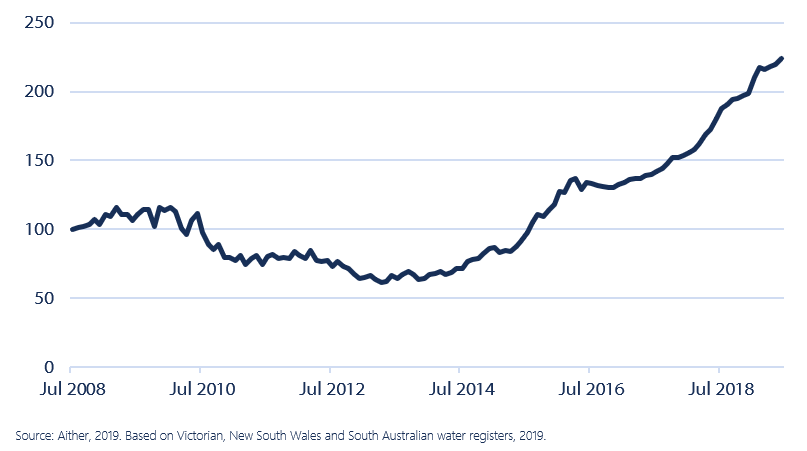
Figure 14 Aither southern Murray-Darling Basin entitlement index, 2008-09 to 2018-19
5.3 Comparison of Trade Prices and Volumes
5.3.1 Higher reliability entitlement types
5.3.2 Lower reliability entitlement types
5.4 Total Entitlement Market Size and Value
A large proportion of the Australian water entitlement market is contained within the southern MDB, by both entitlement on issue and value. The estimated total value of major entitlement types on issue in the southern MDB in 2018-19 is approximately $22.7 billion (based on 2018-19 annual prices reported in state registers, not current fair market price valuations which are substantially higher than these VWAP prices).
Table 5 shows that the major entitlement types held for consumptive use in the southern MDB have an estimated combined value of around $17.6 billion, based on 2018-19 annual prices and excluding the Commonwealth Environmental Water Holder (CEWH portfolio).
Reflecting rapid price increases over the past four years, Aither estimates that the combined value of major entitlement types held for consumptive use have more than doubled since 2014-15 and are approx. 3.7 times the value of the market’s low point in April 2013.
The estimated 2018-19 value of entitlements held by the Australian Government in the southern MDB is approximately $5 billion, which has similarly increased rapidly in value in recent years.
Table 5. Entitlements on issue, annual prices and estimates of market size, major Southern Murray–Darling Basin entitlement types, 2018-19
|
Entitlement type
|
Total entitlement on issue (ML)
|
CEWH held entitlement (ML)
|
VWAP 2018-19 ($/ML)
|
Estimated value of consumptive (million)
|
Estimated value of CEWH purchase (million)
|
|---|---|---|---|---|---|
|
Vic 1A Greater Goulburn HRWS
|
982,364
|
317,453
|
$3,628
|
$2,412
|
$1,152
|
|
Vic 1A Greater Goulburn LRWS
|
426,724
|
42,467
|
$517
|
$199
|
$22
|
|
Vic 6 Murray (above Choke) HRWS
|
320,452
|
90,577
|
$3,830
|
$880
|
$347
|
|
Vic 6 Murray (above Choke) LRWS
|
130,680
|
8,853
|
$558
|
$68
|
$5
|
|
Vic 7 Murray (below Choke) HRWS
|
937,650
|
271,730
|
$4,530
|
$3,017
|
$1,231
|
|
Vic 7 Murray (below Choke) LRWS
|
179,474
|
26,560
|
$620
|
$95
|
$16
|
|
NSW Murray HS
|
189,704
|
20,933
|
$5,740
|
$969
|
$120
|
|
NSW Murray GS
|
1,674,096
|
391,193
|
$1,964
|
$2,520
|
$768
|
|
NSW Murrumbidgee HS
|
363,698
|
10,199
|
$5,762
|
$2,017
|
$59
|
|
NSW Murrumbidgee GS
|
1,891,9995
|
283,203
|
$2,139
|
$3,441
|
$606
|
|
SA Murray (Class 3)
|
607,602
|
161,417
|
$4,578
|
$2,043
|
$739
|
|
TOTAL
|
7,704,439
|
1,624,585
|
$17,661
|
$5,065
|
5.5 Entitlement Market Turnover and Returns
In 2018-19, the market turnover value of major southern MDB entitlement types was approximately $699 million (excluding transfers within irrigation corporations) – which is approximately twice the value for 2017-18 (Table 6). This was driven by the increase in entitlement value and a 48 per cent increase in traded volumes during 2018-19.
Market turnover for major entitlement types varied from 2 per cent to 10 per cent of the total entitlement on issue, with an average of 4 per cent – which is higher than 2016-17. Vic 6 (below Choke) LRWS had the highest per centage market turnover at 10 per cent followed by Vic 7 (above Choke) LRWS and Vic 1A Greater Goulburn LRWS at 7 per cent. The high market turnover and market demand of these lower reliability licences can be attributed to their carryover characteristics.
The sale of water allocation made to entitlements can deliver a financial return to entitlement holders, which we estimate by assuming allocations are sold at annual allocation VWAPs. Average annual gross returns varied among individual entitlements in 2018-19, with Vic 6 Murray (above Choke) HRWS returning 11 per cent followed by Vic 1A Greater Goulburn HRWS and Vic 7 (below choke) HRWS at 10 per cent. Lower reliability entitlements had zero returns on account of reduced or no water allocations during 2018-19, but this analysis does not include returns from leasing carryover which can be significant.
Table 6. Entitlement market turnover and returns, major Southern Murray–Darling Basin entitlement types, 2018-19
|
Entitlement type
|
No. traded
|
Volume traded (ML)
|
Estimated turnover value (million)
|
Estimated turnover (%)
|
Average annual gross return (%)
|
|---|---|---|---|---|---|
|
Vic 1A Greater Goulburn HRWS
|
845
|
38,647
|
$140
|
5%
|
10%
|
|
Vic 1A Greater Goulburn LRWS
|
348
|
27,281
|
$14
|
7%
|
0%
|
|
Vic 6 Murray (Dart to Barmah) HRWS
|
272
|
22,847
|
$88
|
9%
|
11%
|
|
Vic 6 Murray (Dart to Barmah) LRWS
|
142
|
12,516
|
$7
|
10%
|
0%
|
|
Vic 7 Murray (Barmah to SA) HRWS
|
961
|
39,416
|
$179
|
5%
|
10%
|
|
Vic 7 Murray (Barmah to SA) LRWS
|
191
|
12,259
|
$8
|
7%
|
0%
|
|
NSW Murray HS
|
63
|
4,082
|
$23
|
2%
|
7%
|
|
NSW Murray GS
|
75
|
30,944
|
$61
|
2%
|
0%
|
|
NSW Murrumbidgee HS
|
25
|
7,994
|
$46
|
2%
|
7%
|
|
NSW Murrumbidgee GS
|
44
|
22,383
|
$48
|
1%
|
1%
|
|
SA Murray HS
|
165
|
18,710
|
$86
|
4%
|
9%
|
|
TOTAL
|
3,131
|
237,078
|
$699
|
4%
|
5.6 Groundwater
Given price increases for regulated surface water, groundwater is increasingly used as a substitute throughout the southern MDB. There has been increasing interest and subsequent market activity for groundwater entitlements over the past three years especially as drought conditions have progressed and high reliability water entitlements have become more difficult to source.
For instance, the Lower Lachlan, Lower Murrumbidgee Deep and Katunga Deep Lead groundwater aquifers — three of the major southern MDB groundwater markets — have observed a significant price increase over the past three years, in part due to expanding demand for reliable water for cotton plantings as well as for potential horticultural development. Since July 2015 the Lower Lachlan Groundwater annual VWAP has increased from $745 to $3,000 per ML— representing an increase of 302 per cent.
Similar price increases have been observed in other major groundwater systems, with annual VWAPs for the Lower Murrumbidgee Deep and Katunga Deep Lead aquifers increasing 275 per cent and 244 per cent respectively over the same period (Figure 17).

Figure 17. Annual volume-weighted average entitlement prices, major groundwater entitlements, 2008-09 to 2018-19
5.7 Northern MDB Markets
Water markets in the northern MDB have also seen increases in entitlement prices in recent years. The northern MDB has generally been affected by more severe drought conditions than the south — in some places reaching record low inflows.
In comparison to southern MDB markets, northern MDB markets are characterised by relative illiquidity, reduced hydrological connectivity, reduced crop diversity, and an increased prevalence of on-farm water storage and groundwater use.
There has been a decrease in the volume of water traded and an increase in prices over the last three years for most major entitlements in the northern MDB.
Not all catchments have significant numbers of trade, with the most active markets shown in Table 7. Due to the limited number of trades, actual current prices can be significantly different from VWAPs for many of these catchments. However, the annual VWAP based on 71Q licence-to-licence transfers (which tend to be unrelated to land transfers) for Lachlan GS entitlements increased 49 per cent from $671 per ML to $996 per ML from 2017-18 to 2018-19. Likewise, Macquarie and Cudgegong GS, Gwydir GS and Lower Namoi GS increased 32 per cent, 19 per cent and 9 per cent respectively over the year.
Select annual 71q transfer volumes and 71q volume-weighted average prices, New South Wales Northern Murray–Darling Basin entitlement types, 2016-17 to 2018-19
|
Entitlement type
|
2018-19 No.
|
2018-19 Volume (ML)
|
VWAP ($/ML) 2016-2017
|
VWAP ($/ML) 2017-2018
|
VWAP ($/ML) 2018-2019
|
Annual change in price (%)
|
Three-year change in price (%)
|
|---|---|---|---|---|---|---|---|
|
NSW Gwydir GS
|
1
|
2,916
|
$2,200
|
$2,000
|
$2,374
|
19%
|
8%
|
|
NSW Lachlan GS
|
22
|
4,298
|
$532
|
$671
|
$996
|
49%
|
87%
|
|
NSW Lachlan HS
|
2
|
67
|
$1,800
|
$1,998
|
$6,600
|
230%
|
266%
|
|
NSW Lower Namoi GS
|
4
|
2,923
|
$1,935
|
$2,077
|
$2,270
|
9%
|
17%
|
|
NSW Macquarie And Cudgegong GS
|
18
|
2,454
|
$1,157
|
$1,258
|
$1,658
|
32%
|
43%
|
|
NSW Peel GS
|
3
|
365
|
$1,046
|
$1,087
|
$1,341
|
23%
|
28%
|
6.1 Opening Season Allocations To Entitlements
2019-20 opening season allocations were at near record lows (Table 7). Goulburn HRWS did open at a record low of 2 per cent (and equal lowest for the Victorian Murray). South Australian Murray opened at the lowest levels since the end of the Millennium Drought. The estimated volume of water allocated to entitlements held by consumptive users on 1 July was approximately 680 GL.
The lower 2019-20 opening season allocations are equivalent to a reduction of approximately 1,300 GL of water available to consumptive users compared to opening allocations in 2018-19 (not accounting for carryover), approximately a 65 per cent reduction.
Aither estimates that 835 GL of carryover water was retained from 2018-19 to 2019-20 by consumptive users. This is a little over half of the consumptive carryover estimated to be carried into 2018-19 (approximately 1,500 GL).
This estimated volume of carryover, combined with opening season allocations, provided southern MDB consumptive users with more than 1,500 GL of water in accounts in the first week of the current water year (2019-20). To put this in perspective, at the same point in time in 2018-19, consumptive users had access to more than 3,500 GL of water.
The volume available for consumptive purposes — including consumptive carryover — has increased to 2,200 GL by 15 August following allocation increases.
Table 8. Opening season seasonal determinations, 2018-19 and 2019-20
|
Entitlement type
|
2018-19
|
2019-20
|
|---|---|---|
|
Vic 1A Greater Goulburn HRWS
|
32%
|
2%
|
|
Vic 1A Greater Goulburn LRWS
|
0%
|
0%
|
|
Vic Murray HRWS
|
41%
|
2%
|
|
Vic Murray LRWS
|
0%
|
0%
|
|
NSW Murray HS
|
97%
|
97%
|
|
NSW Murray GS
|
0%
|
0%
|
|
NSW Murrumbidgee HS
|
95%
|
95%
|
|
NSW Murrumbidgee GS
|
3%
|
0%
|
|
SA Murray HS
|
100%
|
31%
|
Table 9. Late season seasonal determination outlooks, as of 15 August 2019, 2019-20
|
Entitlement type
|
Extreme Dry (99 per cent chance of exceeding)
|
Very dry (90 per cent chance of exceeding)
|
Median (50 per cent chance of exceeding)
|
|---|---|---|---|
|
Vic 1A Greater Goulburn HRWS
|
35%
|
48%
|
95%
|
|
Vic 1A Greater Goulburn LRWS
|
0%
|
0%
|
0%
|
|
Vic Murray HRWS
|
35%
|
52%
|
100%
|
|
Vic Murray LRWS
|
0%
|
0%
|
0%
|
|
NSW Murray HS
|
97%
|
97%
|
97%
|
|
NSW Murray GS
|
0%
|
0%
|
0%
|
|
NSW Murrumbidgee HS
|
95%
|
95%
|
95%
|
|
NSW Murrumbidgee GS
|
3%
|
3%
|
32%
|
|
SA Murray HS
|
100%
|
100%
|
100%
|
6.2 Allocation Market Outlook
6.2.1 Market conditions and drivers
Dry opening conditions
Reflecting poor opening allocations, the market opened the 2019-20 water year above $600 per ML.
Market participants have been slow to begin trading this year. Only 38 GL was commercially traded over the month, approximately half of the volume traded in July of 2018-19. In part, this is due to less water being available. However, brokers report that many buyers have been put off by the high price point and are waiting to see if prices will decline.
The reduced water availability will likely dominate market conditions over 2019-20, and potentially into 2020-21. Bureau of Meteorology and international forecasts of the major climate drivers suggest the winter and spring period — in which the southern MDB normally receives its most important inflows — are likely to remain unfavourable (Figure 18). This suggests that this year’s inflows could be below average, compounding several years of low inflows.

Figure 18. Australian spring rainfall outlook, August to October, 2019
6.2.2 Market conditions and drivers
Developing conditions and cropping decisions
Rainfall and inflows from August to November will be critical in determining if there is any sort of water availability turnaround, thereby driving annual cropping production decisions for 2019-20, and allocation prices for this year and next year.
At current prices, Aither expects that many cotton, rice and other cropping enterprises will become sellers, provided they receive any water allocations at all. As a consequence, production would be low in these industries without a quick and significant turnaround in water availability. Continuing the trend from recent years, we may see more irrigation farmers exiting this year.
Horticulture, Lower Murray water demand and trade restrictions
While some permanent horticulturalists have already secured their water for the year, others will be waiting and hoping for an improvement in allocations before entering the market to secure their needs for this year and next. We expect this to keep prices high, particularly in the Lower Murray.
Aither expects that inter-valley trade (IVT) rules will have large impacts on the distribution of water use and prices in 2019-20. At the time of writing, Lower Murray irrigators were unable to access water markets in the Murrumbidgee, Goulburn, Lower Darling or Upper Murray as the Murrumbidgee IVT, Goulburn IVT and Barmah Choke are closed (Figure 19). If this continues, the price in the Lower Murray is expected to rise above current levels, in the absence of a big increase in allocations. Meanwhile Upper Murray, Goulburn, and Murrumbidgee prices may flatten or even ease if the trade restrictions continue
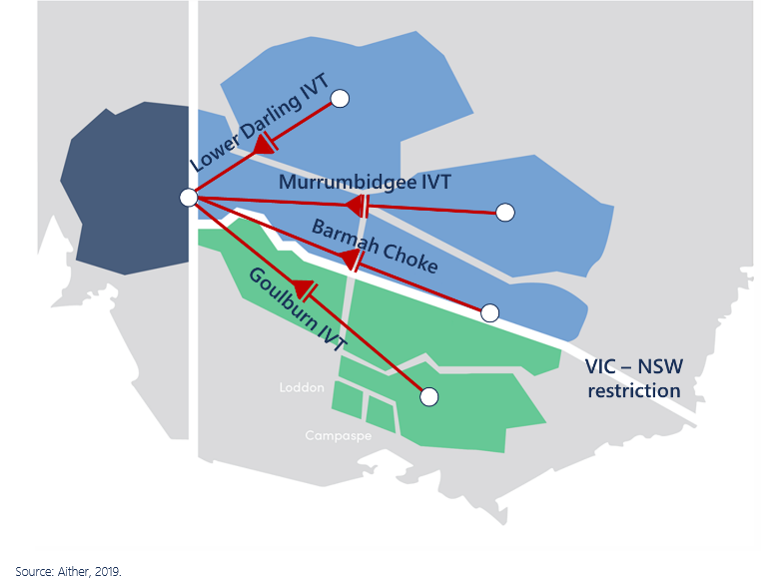
Figure 19. Early season trade closures, August 2019
Price forecast for 2019-20
Based on current climate outlooks, a major turnaround in water availability appears unlikely. Inflows over the year-to-date and state-based seasonal determinations outlooks suggest that it will remain dry or worse, with allocations lower than the same time in 2018-19.
Based on a dry or extreme dry outlook in 2019-20, we expect between approximately 2,500 and 3,300 GL of water to be available for consumptive use from allocations to entitlements across major southern MDB surface water systems (including approximately 835 GL of consumptive carryover).
Using Aither’s water markets model, we estimate that the average annual allocation price in the southern MDB (excl. Murrumbidgee) will be approximately $425 per ML under a dry scenario and $590 per ML under an extreme dry scenario. However, this assumes a degree of inter-regional trade which we are unlikely to see this season as a result of IVT limits, as noted above. Depending on the arrangement of these trade restrictions, we expect the Lower Murray could trade at or above this price level, while the Goulburn and Upper Murray is expected to trade at or below this level — meaning a range of prices is ultimately possible (Figure 20).
Under current conditions, our model predicts trade will move the maximum volume out of the Murrumbidgee, which will be left with an average price of between $360 and $380 per ML, but this will be strongly influenced by allocations to General Security entitlements.
Goulburn
Trade has already closed from the Goulburn to the rest of the southern MDB — and accordingly the price has already fallen below other southern MDB allocation prices. We expect this divergence to grow and only come back to an equilibrium with the Murray if the IVT re-opens or towards the end of the season. With much less high-value horticulture in the Goulburn, prices could drop substantially if the IVT remains closed.
Murrumbidgee
Allocation trade movements have reversed from 2018-19 when the limits on the volume of water into the Murrumbidgee were reached. The high price combined with full allocations to High Security entitlements in the Murrumbidgee has increasingly moved water out to the Murray and the limit on trade out of the Murrumbidgee was reached on 16 August 2019. We expect trade to remain closed from the Murrumbidgee throughout 2019-20. The eventual allocations, demand for carryover to 2020-21 and the area of cotton planted will ultimately determine the local price, although it is expected to be lower than in the Lower Murray.
Murray and end of season dynamics
As discussed above, the water demand in the Lower Murray has grown rapidly, and is inflexible, based on the ongoing needs of permanent horticulture. Trade into the Lower Murray is already prohibited from above the Barmah Choke, the Murrumbidgee, the Goulburn and the Lower Darling. If conditions remain poor, and the other regions are unable to supply water to the Lower Murray, prices may rise further over 2019-20.
As the season progresses, these enterprises will increasingly look forward to 2020-21 and will seek to secure water supply — which has the potential to leave water demand outstripping supply, potentially driving prices up further.
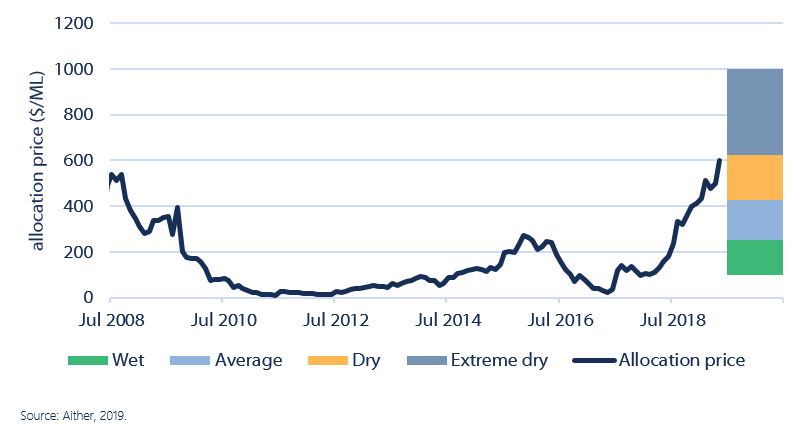
Figure 20. Outlook for average annual southern MDB allocation prices compared to current allocation prices, connected Murray, 2019-20
6.2.3 Previous model accuracy
For the 2017-18 Aither Water Markets Report, we estimated 2018-19 water market prices using our previous water allocation price model. Under dry conditions, the model estimated the annual price would be $240 per ML throughout the southern MDB. In last year’s report, under extreme dry conditions, the model estimated the price would be $315 per ML throughout the southern MDB.
Despite there being no single price for water allocations across the southern MDB in 2018-19, the approximate average annual price for the connected southern MDB was around $423 per ML, which is significantly higher than Aither’s estimates based on outlooks available at the time (Figure 21).
The source of the discrepancy stems from both supply and demand factors. On the supply side, actual conditions were extremely unfavourable — especially for General Security entitlements in NSW and in-crop rainfall.
On the demand side, as described previously, significant new water demand has entered the market from cotton and permanent horticulture throughout the southern MDB. As well as having a higher willingness to pay (raising the price in all water years), permanent horticulture has much less flexible water demand, which means prices are likely to increase at a faster rate under dry and extreme dry conditions.
6.2.4 Changes to the water market model
Aither’s water market model has developed over time. In addition to splitting the Murrumbidgee from the connected Murray, Aither has made more recent changes to the model. To better reflect the change in water demand, there has been a structural change to the model, as well as improvements to the input data. As a result, the model performs better when estimating dry and extreme dry conditions.
Aither is continuing to re-develop the model in 2019 to enable greater accuracy and enhanced insights across trade zones.
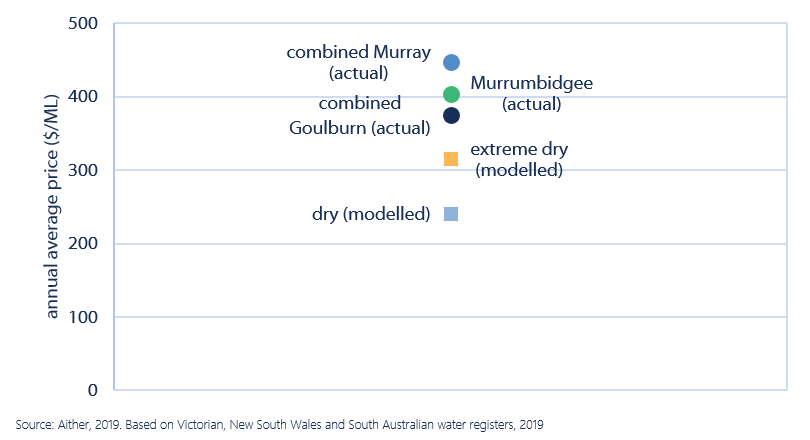
Figure 21. Comparison of observed and modelled average annual allocation prices, 2018-19
6.3 Entitlement Market Conditions and Outlook
Entitlement price increases continued throughout 2018-19, particularly for high security/reliability entitlements which yielded strong returns from selling water allocations this year (Table 6).
Reflecting high demand, prices have particularly increased for the high-reliability entitlements that can supply water to the Lower Murray: Vic Murray Zone 7 HRWS, NSW Murray Zone 11 HS, and SA Murray Class 3 — and, to a certain extent, Murrumbidgee HS.
Accordingly, significantly sized parcels of these entitlement types appear to be increasingly difficult to source from markets. In the last few months, prices for Victorian Murray Zone 6 and Goulburn 1A HRWS entitlements have increased, but there remains a very large price differential when compared to entitlements held below the Barmah Choke.
These increasing entitlement values reflect the positive conditions for several irrigated commodities (cotton, almonds, citrus and table grapes), and increasingly the trade restrictions which limit inter-valley movement of water. Prices also reflect the low-interest rate environment and strong demand for real assets.
According to brokers, buyers remain diverse and include:
- Enterprises topping up smaller water portfolios to secure their long term needs.
- Water funds and investors continuing to see value in entitlements on the basis of lease products and forward contracts.
- Some large corporate agribusinesses that are making strategic purchases to manage risk and underpin long-term permanent developments.
High Reliability
With limited supply and strong demand, prices continue to increase for high-reliability entitlements. There are no signs of a turnaround in the market and early entitlement trading in 2019-20 indicates further upward movement in some entitlements. However, the value of these entitlements are ultimately determined by the value of the agricultural products that can be produced. As such, we anticipate that while prices may increase, the rate of increase will eventually begin to slow. Reflecting the highly fragmented markets in 2019-20, we anticipate that entitlement price movements will increasingly be dominated by the tradability of allocations associated with each entitlement type.
General Security and Low Reliability
Over 2018-19, poor allocations contributed to price decreases for NSW GS entitlement types. It appears unlikely these entitlements will receive significant allocation over 2019-20 and pressure to sell may keep entitlement prices subdued, with further declines possible but strong demand likely to kick in if the price for Murray GS does drop further.
Given there is likely to be an abundance of potential carryover space relative to water supply, the value of low-reliability entitlements for this purpose is somewhat constrained in the short-term. However, carryover space remains in demand by horticulturalists looking to manage their own supply security from year to year.

Figure 22. Aither Entitlement Index, 2008-09 to 2018-19
References
Aither 2019, Water supply and demand in the southern Murray–Darling Basin
Aither 2018, Aither Water Markets Report 2017-18 review and 2018-19 outlook
Aither 2017, Aither Water Markets Report 2016-17 review and 2017-18 outlook
Aither 2016, Aither Water Markets Report 2015-16 review and 2016-17 outlook
Australian Bureau of Statistics (ABS) 2018
Bureau of Meteorology (BoM) 2019
Commonwealth Environmental Water Holder (CEWH) 2019
New South Wales Water Register 2019
About Australia’s Water Markets
Background
Australia’s water markets are comprised of two distinct but related markets – the entitlement market, and the allocation market. There is no single national market for these products, but rather a number of individual separate markets. Where hydrological connectivity exists, such as in the southern Murray–Darling Basin, trade between these markets is possible.
- Water entitlements are ongoing rights to receive a share of available water resources in a consumptive pool. They are analogous to a land property right, are generally secure and mortgageable in the same way, and have substantial value. Each catchment typically has a small number of entitlement ‘classes’, and generally all entitlements within a given class are homogenous.
- Water allocations are the volumes of water allocated to water entitlement holders during the water year (1 July to 30 June). They are a physical good analogous to a commodity, and are extracted from water courses and applied as inputs to production or the environment. Their value per unit varies within and between years.
ENTITLEMENT MARKET
Purpose, use and operation
An entitlement specifies an annual volumetric share of available resources in a given catchment or water system, which the holder will receive as water allocations, subject to rainfall, inflows, water held in storage and other factors. The entitlement market enables trade in the ongoing right to receive these water allocations. Entitlements can be held by virtually any party in any location.
The entitlement market is largely used by irrigated agricultural producers, but is increasingly being used by investors, water utilities (including urban suppliers) and environmental water holders. These users use the market to modify their long-term arrangements for facilitating production, or meeting environmental requirements, or urban demand.
Similar to the allocation market, state government agencies govern the operation of the entitlement market, including rules and regulations regarding how and where trade can occur. Depending on the jurisdiction, other agencies (such as land titles or property registration agencies) will be involved, given entitlements’ nature as secure property rights. Third parties (such as exchanges, brokers and conveyancers) often play a role in facilitating entitlement trade.
Key drivers of market outcomes
The value of water entitlements is largely determined by their reliability characteristics, which differ between each entitlement class. Higher reliability entitlements provide greater water allocations over the long term, and more consistently provide water allocations each year.
Trade in entitlements is related to longer-term production decisions and the characteristics of different irrigated agricultural enterprises, including their tolerance for risk. Producers who may be expanding or contracting production drive market activity, as do investors or larger scale enterprises that may hold entitlements and facilitate new models of irrigation farming based on trading annual allocations rather than holding entitlements. Purchases of water on behalf of the environment have also driven market activity in recent years.
ALLOCATION MARKET
Purpose, use and operation
The allocation market provides the ability to trade physical water between parties for use, further trade, or carryover. Allocation trade can generally only occur between parties that are hydrologically connected such that water can be delivered between them (or substituted by other water from a shared storage).
The water allocation market is mainly used by irrigated agricultural producers (including rice, dairy, horticulture, cotton and others), and environmental water managers. Irrigators use the market to sell water excess to requirements, or buy additional water for use during dry periods or when temporarily expanding production. Environmental water holders may similarly buy or sell when they have short-term surpluses or deficits.
State government regulators determine annual allocations based on entitlement characteristics (which determine priority and how much water is allocated to individuals), and market rules to manage issues such as connectivity between systems and transmission losses. State governments, either directly or via their water utilities, play a key role in facilitating allocation trade, including ensuring compliance with rules and regulations, and by approving and processing trades. Parties seeking to trade allocations may utilise intermediaries such as water exchanges and brokers.
Key drivers of market outcomes
The amount of water allocated to entitlement holders each year is a key driver of allocation market outcomes (including prices and volumes traded) because it strongly influences the total amount of water available for use or trade. When allocations are low, water is scarce and prices are high. The opposite is true when allocations are high. Allocation levels reflect broader water availability, including rainfall and inflows in relevant catchments, and volumes held in storages. Other key drivers in allocation markets include conditions in markets for irrigated agricultural products, and conditions in substitute input markets.
Download Water Markets Report Notes
Rounding errors
Irrigation corporation trade data
Aither Entitlement Index
Table notes
figure notes


