Background
Australian water management has undergone a significant period of reform over the past three decades. The establishment of water markets has been a key component of this reform story.
Water markets are now an established part of agricultural, urban and environmental water policy, management and investment in Australia.
The Aither Water Markets Report provides an overview of current water market activity in the southern Murray–Darling Basin, compares market outcomes with recent years and comments on the future outlook.
Download the PDF here

About Aither
Our Water Market Services
We are a team of award-winning, independent water markets, policy, and infrastructure advisors.
Every day we help businesses and governments make better decisions about scarce water resources.
We do this by providing high-quality information, insights and analysis that help our clients design and implement strategies for successfully participating in Australia’s water markets. Our team also provides policy and regulatory insights and infrastructure advisory services.
Whether you need custom-designed water strategies or assessments of your exposure to water-related risks and opportunities, we’ll help you make clear, informed and confident water decisions.
Executive Summary
Facts at a glance – 2019-20
- Estimated value of commercial allocation trade in major southern MDB trading zones: $538 million.
- Annual average southern MDB allocation prices: $304 per ML in NSW Murray (above Barmah) to $644 per ML in Vic 7 Murray (Barmah to SA).
- Estimated value of total southern MDB entitlements on issue: $26.3 billion.
- Aither Entitlement Index (AEI) 30 June 2020: 237 points (up 6 per cent over 12 months).
- Value of total entitlement transfers: $1,073 million.
- Total volume of entitlement transfers (outside of irrigation corporations): 257 GL (up 8 per cent on 2018-19).
- Entitlement market turnover: 3 per cent.
- Average annual high security and high reliability entitlement returns (sale of allocations): between 6 and 9 per cent.
Summary of 2019-20
Tight water supply conditions and some of the highest water allocation prices since the Millennium drought made 2019-20 a challenging year for most irrigators in the southern Murray-Darling Basin (MDB).
Allocation markets
- The tight water supply conditions experienced in the first half of the water year, alongside high demand from permanent horticulturalists to secure water and binding trade constraints, resulted in record-breaking water allocation prices across the southern MDB.
- Water prices in the lower Murray peaked at approximately $970 per ML (weekly volume-weighted average price) in November 2019.
- Allocation prices collapsed in the second half of the water year. This was driven by timely in-crop rainfall and market optimism buoyed by successive rainfall outlooks indicating a return to wetter than average conditions.
Entitlement markets
- After extraordinary year-on-year growth in water entitlement markets, from 2014 to December 2019, entitlement prices progressively declined in the second half of 2019-20. February to June 2020 was the first month-on-month pull back in the Aither Entitlement Index for over three years.
- Demand for high reliability and high security water entitlements declined in 2019-20, resulting in more modest price increases for much of the year compared to previous years. This may reflect market participants’ caution due to global commodity trade tensions, uncertainty about the economic implications of the COVID-19 pandemic, more promising rainfall conditions and outlooks, and questioning about whether entitlement prices may have reached a natural peak.
- Market activity for low reliability and general security entitlements was heavily influenced by high demand for carryover space in the second half of the water year, particularly in the lower Murray.
Facts at a glance – Outlook
- Comparison of 2019-20 and 2020-21 opening season allocations to consumptive users (excluding carryover): 500 GL more water allocated at opening of 2020-21.
- Estimated 2020-21 total end of season volume of water available to southern MDB consumptive users under average inflows scenario (including carryover): approximately 4,600 GL.
- Bureau of Meteorology three-month rainfall (August to October) outlook for southern MDB: Above average.
- Current (early August 2020) southern MDB allocation prices: $250 to $350 per ML.
Outlook for 2020-21
After three dry years, southern MDB water markets are on a knife’s edge. Although, 2020-21 allocations opened higher than last year, and the rainfall outlooks are more promising, the rains need to come to materially improve water availability in 2020-21.
Allocation markets
- One month into the new water year, conditions are dry, trade constraints are binding, and water allocation prices are already starting to tick upwards. Spring rainfall and inflows will be crucial in determining allocation price trajectories through the season. We also anticipate the continued influence of the inter-valley trade constraints.
- If the rains do not come, demand from winter croppers could combine with demand from permanent horticulturalists looking to secure their water for subsequent seasons, placing upwards pressure on prices.
- If the rains come and downstream trade opportunities remain closed, allocation prices above the constraints might return closer to historical averages (between $100 and $200 per ML).
- Prices will be higher in the lower Murray; how high will be influenced by when permanent horticulturalists opt to secure water for subsequent years. The key actions to watch relate to how horticulturalists draw on their carryover and the positions they take for next season, and whether annual summer croppers commit to planting programs, particularly in the Murrumbidgee.
Entitlement markets
- The long-term outlook for entitlement markets remains strong. However, short-term factors such as an uncertain global commodity trading environment, the emerging economic ramifications of COVID-19, and ongoing regulatory uncertainty will likely influence entitlement prices in 2020-21.
- High reliability and high security entitlement markets may continue the recent trend of softening in 2020-21. However, depending on the extent of the price correction and resolution of regulatory uncertainty, some market participants may re-enter the entitlement market and underpin prices.
- With many permanent horticulturalists needing to secure increased volumes of water as their plantings mature, demand for Victorian low reliability water shares, particularly those in Zone 7, will likely be sustained.
- NSW general security entitlement values will be more heavily influenced by climate and water availability than other entitlement types.
1.1 Introduction
Now in its seventh year, the Aither Water Markets Report provides water market participants, advisors, investors, and policy professionals with an annual snapshot of recent water market drivers and activity in the southern Murray-Darling Basin (MDB) (Figure 1).
This year’s report highlights the key drivers of the historically high water allocation prices observed in 2019-20, including:
- unprecedented dry conditions
- a continuation of fundamental changes to water supply and demand
- the increasing influence of inter-valley trade constraints.
We also draw attention to the potential beginning of a new phase in water entitlement prices, and the ongoing policy and regulatory uncertainty.
As we look ahead from August 2020 (the time of writing), our outlook for 2020-21 explores how these factors may influence water markets in the southern MDB over the next 12 months.

Figure 1. Water trading zones in the southern Murray-Darling Basin
Source: Aither, 2020.
Aither Entitlement Index
As the only index of its kind in Australia, the Aither Entitlement Index (AEI) provides a simple and reliable snapshot of water entitlement performance throughout the southern Murray-Darling Basin.
Across the 2019-20 water year, the AEI increased by 6 per cent compared to 24 per cent in 2018-19. While the AEI increased 13 per cent between July 2019 and January 2020, February 2020 marked an inflection point. February to June 2020 was the first month-on-month pull back in the AEI for over three years (down 6 per cent) (Figure 2).
The Aither Entitlement Index can show inflection points in entitlement price trends.
While the recent decline of the AEI is causing market participants to question whether this is a speed bump on the journey to ever increasing entitlement values or an enduring correction, the pullback has been relatively modest. The AEI is currently at about the same level as it was in October 2019. The Compound Annual Growth Rate of the AEI is 7 per cent since it’s inception in 2008.
Aither’s independent water market specialists update the AEI monthly using our in-house southern Murray-Darling Basin water asset valuations. The AEI supports better decision making by providing irrigators, investors, banks and other water owners with a reliable benchmark to track the capital value performance of water portfolios and investments, and attract new investors.

Figure 2. Aither Entitlement Index, 2008-09 to 2019-20
Source: Aither, 2020.
2.1 Climatic Conditions
Unprecedented dry and warm conditions
2019-20 was the third dry year in a row.
Influenced by the strongest Indian Ocean Dipole (IOD) on record, severe drought conditions characterised the first half of the water year. The majority of the MDB recorded below average rainfall and some regions recorded the lowest rainfall on record. These unprecedented dry and warm conditions contributed to catastrophic bushfires in south eastern Australia over the summer months.
The 36 months from February 2017 to January 2020 was the driest such period on record for the MDB (Figure 3). 2019 was also the warmest and driest year on record. Australia’s mean temperature was 1.52OC above average (Bureau of Meteorology, 2020).
Rainfall in the second half of the water year brought some relief
The IOD finally neutralised at the start of 2020. The first six months of 2020 were wetter than average for many regions across the MDB, particularly in the east (Figure 4).
These rains eased late summer demand and provided an early autumn break. They soaked headwater catchments, creating good runoff conditions that resulted in material inflows into southern MDB storages in May and June.

Figure 3. Rainfall deciles for the Murray-Darling Basin, 1 February 2017 to 31 January 2020 (driest 36-month period on record)
Source: Aither, 2020. Based on Bureau of Meteorology, 2020.

Figure 4. Rainfall deciles for the Murray-Darling Basin, 1 January 2020 to 30 June 2020
Source: Aither, 2020. Based on Bureau of Meteorology, 2020.
Failed winter-spring rains created challenging conditions
The dry conditions across the MDB were reflected in on-farm rainfall throughout annual cropping regions in the southern MDB. In the first half of the water year, between August and December, all growing regions received below median monthly rainfall (Figure 5).
These challenging conditions meant many annual croppers opted not to commit to large planting programs. The area of summer crops planted in New South Wales was 79 per cent less than in 2018-19. The area planted to cotton fell by 83 per cent due to low irrigation water supply and soil moisture levels that were insufficient for dryland cotton crops (ABARES, 2020a).
The on-farm rainfall situation reversed in the second half of the water year. Annual cropping regions received above median rainfall between February and April (Figure 5). This high level of timely rainfall created the best start to the winter cropping season in three years, especially in New South Wales. Many annual croppers commenced large winter crop planting programs (ABARES, 2020a).


2.2 Storages
Drawdown on storages was 52 per cent less than in 2018-19
The unprecedented dry conditions, combined with severe long-term rainfall deficits, meant inflows to storages were very low in winter and spring and through to the end of summer. These conditions resulted in a continuation of the downwards trend in the volume of water held in storage in the southern MDB since 2016 (Figure 6).
While the downwards trend continued for much of the year, the annual drawdown on southern MDB storages was more than half (52 per cent) of the drawdown in 2018-19, with high allocation prices suppressing demand from summer croppers.
- In 2018-19, the drawdown was 4,053 GL.
- In 2019-20, the drawdown was 1,953 GL.
Southern MDB storages began to be replenished following early 2020 rainfalls. Between 29 February 2020 and 30 June 2020:
- Lake Eildon (Victorian Goulburn system) increased 33 per cent, to 1,538 GL.
- Blowering (NSW Murrumbidgee system) increased 52 per cent to 912 GL.
- Upper Murray Catchment (Hume and Dartmouth systems) increased by 38 per cent to 3,079 GL.
The reduced annual drawdown and good inflows at the end of the year combined so that 2019-20 closed with more water in storage than at the start of the season (increase of 12 per cent).

Figure 6. Volume held in storage, southern Murray-Darling Basin major headwater storages, 2012 to 2020
Source: Aither, 2020. Based on Bureau of Meteorology, 2020.
2.3 Allocations
Lowest total volume of allocations since the Millennium drought
The total volume of water allocated to all entitlements (including environmental water holdings) across the southern MDB in 2019-20 was the lowest since the Millennium drought. Total water allocations were approximately 2,953 GL, which is 1,047 GL more than in 2008-09 (Figure 7).
Total allocations in 2019-20 also continued a downwards trend in water availability over the last four water years. Allocations were 57 per cent less than in 2016-17 (Figure 7).
The influence of allocations to NSW general security entitlements on water availability can be seen in the last two water years shown in Figure 7. As a lower reliability entitlement product, NSW general security entitlements have only received substantial allocations in wetter than average years (2010-11 to 2013-14 and 2016-17 to 2017-18).

Figure 7. Estimated total volume of water allocated to water entitlements in the southern Murray-Darling Basin, 2007-08 to 2019-20
Source: Aither, 2020. Based on Victorian, New South Wales, and South Australian water registers, 2020.
Note: Allocations to all entitlement categories are shown, including allocations to environmental water holdings and Victorian water corporation holdings.
Closing allocations in Victoria were some of the lowest since the Millennium drought
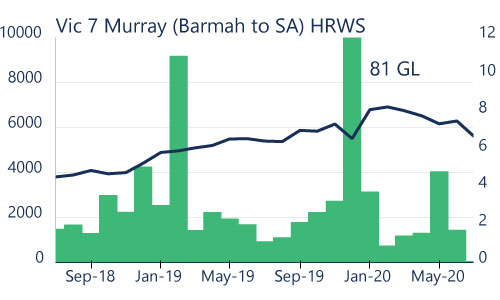
Allocations to Victorian HRWS fell well short of 2018-19 allocations. Vic Murray HRWS and Vic Goulburn HRWS ended the year at 66 per cent and 80 per cent respectively (Figure 8). This marks 2019-20 as the first time Vic Murray HRWS has not reached 100 per cent since the very low allocations experienced in 2008-09.
South Australian irrigators had to wait longer than usual to receive a full allocation. It took until the second allocation announcement in November for SA Murray HS to reach 100 per cent (Figure 8).
2019-20 opening allocations for Vic Goulburn HRWS (2 per cent) and SA Murray HS (31 per cent) were the lowest in the last 10 years (since 2010-11). Opening allocations for Vic Murray HRWS (2 per cent) were the second lowest over the same period (Figure 8).
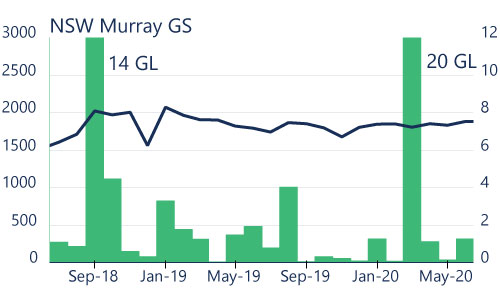
NSW Murray HS and NSW Murrumbidgee HS received their full allocation at 1 July 2019 (97 per cent and 95 per cent respectively), highlighting the value of these entitlements (Figure 8).
NSW Murray GS received a 3 per cent allocation in May 2020, and NSW Murrumbidgee GS increased from 6 per cent to 11 per cent at the same time (Figure 8). These allocation increases late in the season and the above-average rainfall in early 2020 contributed to the market optimism that placed downward pressure on prices.


2.4 Demand for Water
Water use responded to reduced supply and high prices
Total water use in 2019-20 was lower than in 2018-19. This is reflected in the difference in the seasonal drawdown on water storages between 2018-19 and 2019-20 (Section 2.2). The reduced drawdown in 2019-20 was largely a result of annual croppers opting not to plant due to the tight water supply conditions and high water prices in the first half of the water year.
However, permanent horticultural water demand will continue to be a key driver of overall water demand in the southern MDB, particularly in the lower Murray. Aither’s updated estimates of water supply and demand in the lower Murray indicate that water use from existing permanent horticulture in the lower Murray was approximately 1,122 GL (2018-19). In the absence of any demand-side response, demand could increase by 125 GL once existing permanent plantings reach full maturity, and a further 167 GL if planned developments come online (all permanent horticultural crops, not just almonds) (Figure 9).
If this happens in a year with similar water supply conditions to 2019-20, lower Murray irrigators will be reliant on carryover of water from one season to the next and inter-valley trade to manage risk.

Figure 9. Water supply and demand in the lower Murray, based on 2019-20 water supply compared to 2018-19 estimated water demand from permanent horticulture (existing, existing (at full maturity) and potential (at full maturity))
Source: Aither, 2020b.
Note: The demand estimate includes demand from vegetable growing in the Victorian and New South Wales Sunraysia.
2.5 Implications for the Market
Record breaking water allocation prices in 2019-20
Water allocation prices reached all-time highs in 2019-20. The annual volume-weighted average price (VWAP) across major trading zones in the southern MDB was $583 per ML, $51 higher than the second highest annual average price in 2007-08.
Monthly VWAPs show a more nuanced story. While the highest monthly VWAP was recorded in the Millennium drought ($1,010 per ML in November 2007), in that year, allocation prices above $500 per ML were sustained for only four months. In 2019-20, monthly VWAPs were above $500 per ML for most of the year (nine months).
Allocation prices above $500 per ML for so much of the first half of the season effectively priced annual summer croppers out of the market. Motivated by the persistent dry conditions, 2019-20’s high water prices largely reflected permanent horticulturalists attempts to secure water for the current season and the next. These dynamics meant that in the second half of 2019-20 there was considerably reduced demand for allocations and prices collapsed. This situation is vastly different compared to 2018-19 when it was also dry, but allocation prices were low enough for annual croppers to remain in the market.
Allocation prices will continue to be influenced by the structural changes that are playing out across irrigated agricultural industries in the southern MDB. Favourable commodity prices have incentivised the development and expansion of permanent horticulture plantings, particularly in the lower Murray. Permanent horticulturalists tend to have inflexible water demands and a higher willingness to pay than other irrigators.
While allocation prices were very high in 2019-20, inter-valley trade and carryover enabled most permanent horticulturalists to meet their water needs. Other factors that helped permanent horticulturalists include milder autumn conditions compared to 2018-19 and drying off of some lower value permanent horticulture (e.g., some varieties of wine grapes).

Figure 10. Annual and monthly volume-weighted average prices, and total water allocated to major entitlement types, southern Murray-Darling Basin, 2007-08 to 2019-20
Source: Aither, 2020. Based on Victorian, New South Wales, and South Australian water registers, 2020.
3.1 The Year in Water Policy and Management
If 2018-19 was a tumultuous year for water policy and management, 2019-20 proved there is always room for more turbulence when it comes to managing Australia’s water resources.
In late 2019, old and new water management debates flared up. Fueled by water allocation prices reaching levels not seen since the peak of the Millennium drought and spring inflows that were well below long-term averages, water policy in the MDB was one of the main issues gripping mainstream media. The last time water markets and policy were the subject of such intense scrutiny was during the Millennium drought. It has taken a global pandemic to push water policy out of the headlines.
At the Federal level, calls from some groups spurred a series of inquiries. Two of these – the Australian Competition and Consumer Commission’s (ACCC) Murray-Darling Basin Water Markets Inquiry and the Independent Assessment of the Social and Economic Conditions in the Basin – were announced this time last year and are nearing completion. Then in December 2019, some NSW irrigators who have faced low to zero general security allocations for several years, protested at parliament in Canberra, initiating the Interim Inspector-General’s Inquiry into the Impact of Lower Inflows on State Shares under the Murray-Darling Basin Agreement. Key themes within each of these inquiries are the realities that inflows over the last 20 years are much lower than the longer-term historical record and that there is a need to improve transparency across water markets, and water policy more generally, to improve public confidence.
Further Federal drought assistance was also declared in the form of the controversial Water for Fodder program, supported by an agreement with the South Australian government to provide water from the Adelaide desalination plant to upstream farmers.
Basin states continue to work on challenging inter-jurisdictional issues such as the risk of delivery shortfalls in the lower Murray, while the Victorian government has embarked on major changes to the Goulburn to Murray Inter-Valley Trade Rule. The majority of state water resource plans (WRPs) – plans that set out rules for how water can be used in each catchment in line with the MDB Plan (Basin Plan) – have now either been accredited by the Commonwealth Minister for Water, or recommended to the Minister for accreditation by the Murray-Darling Basin Authority (MDBA). Nine surface-water WRPs, all from New South Wales, are currently with the MDBA for assessment. Should the plans be recommended to the Minister for accreditation it would mark the end of a period of uncertainty about water allocation rules. This would be a significant achievement for water reform in the MDB. However, this may not happen for some time because proposed changes to environmental water protections and floodplain harvesting rules in the WRPs may spark debate.
Figure 11 presents the key policy events from 2019-20. Summaries of the key events and the likely implications for water market participants are also presented.


Figure 11. Timeline of Murray-Darling Basin water policy events, 2019-20
Source: Aither, 2020.
3.2 Summary of Key Water Policy Events
ACCC Murray-Darling Basin Water Markets Inquiry
In August, the ACCC started its inquiry into markets for tradeable water rights in the MDB. Specifically, the Federal Treasurer requested recommendations that will enhance the operations, transparency, regulation, competitiveness and efficiency of water markets. The interim report was submitted to the Treasurer on 30 June 2020, and publicly released on 30 July 2020. The final report is due on 30 November 2020.
Implications for water market participants: The ACCC have highlighted the need for potential changes to the way markets are governed, operated and regulated that will potentially have implications for market participants conduct and decision making.
Inquiry into the Impact of Lower Inflows on State Shares Under the Murray-Darling Basin Agreement
Following irrigator protests in Canberra, then Federal Minister for Water Resources, David Littleproud, announced an inquiry into inter-state water sharing arrangements. Led by the Interim-Inspector General of Murray-Darling Basin Water Resources, the inquiry investigated changes to inflows into the Basin and their impact on state bulk water allocations, and issues related to river operations and delivery, environmental water, communications and leadership. The major finding was that reduced inflows over the last 20 years have been the primary driver of reduced water allocations in the southern Basin. The inquiry also concluded that there are gaps in publicly available information on delivery and allocations; variations in state allocations are a result of low inflows and state allocation frameworks; conveyance losses have been commensurate with current climate conditions and there is a need for greater transparency, communication and literacy. Federal Minister for Water, Keith Pitt, accepted all the recommendations upon the release of the report in April 2020.
Implications for water market participants: Market participants may need to prepare for a future characterised by water availability that looks more like the last 20 years than the last 100 years. Aither’s new water allocation price modelling highlights the importance of climatic conditions in driving future allocation prices.
Victorian Water Market Transparency Options Paper and Consultation
Continuing the theme of transparency, in 2019 the Victorian government explored options to improve the provision of clearer market information that gives participants better access and the confidence to make informed decisions. In December, following community consultation, the Victorian Minister for Water, Lisa Neville, announced a suite of actions to make more information about water ownership publicly available. The actions include:
- publishing the names of companies who own two per cent or more water in a system and pursuing legal changes to report this information for individuals.
- reporting market activity for non-water users and pursuing legal changes to allow publication of information of accounts that make more than 20 trades per year.
- providing more clarity on different types of trades.
- listing brokers who meet government standards and auditing requirements.
As of June 2020, the Victorian Water Register has started releasing improved information via new online water trading dashboards.
Implications for water market participants: Information made available through the online water trading dashboards will help market participants with their carryover strategies and market positioning. Participants should watch for changes to increased ownership and trade disclosure obligations.
Review of the Goulburn to Murray River Trade Rule
Sustained environmental damage to the Goulburn River from several years of high delivery volumes to the lower Murray prompted the Victorian government to review the Goulburn to Murray trade rule. In December 2019, an interim regime came into effect that included tagged trades within the 200 GL trade out limit. Consultation commenced in March 2020. The proposed trade rule options include: implementation of an annual cap on trade; a dynamic two-part trade rule based on the timing of trade; and a seasonally based rule coupled with an annual limit on trade. In June 2020, the MDBA agreed to the Victorian government’s request to cap deliveries to the Murray during summer to 40 GL per month while the outcomes of the review are pending.
Implications for water market participants: While the volume of the reduction, or what the new trade rules will look like is still unclear, the likely outcome of the review is that less water will be able to be traded or transferred from the Goulburn to the Murray. This will have implications for the value of Goulburn entitlements, and may place downwards pressure on allocation prices in the Goulburn. It will also add to water scarcity concerns in the lower Murray.
New South Wales Carryover Restrictions
In August 2019, the NSW government released its policy principles for the treatment of carryover, including how restrictions are imposed. The principles specify that if there is insufficient water available to provide full high security allocations, allocations will be restricted and access to general security carryover water will be restricted to the same or greater extent. It also specified that carryover accounts will be fully suspended if restricted high security allocations cannot be met from storage and forecast inflows. In February 2020, the NSW government announced that restrictions to carryover would likely be low risk for 2020-21.
Implications for water market participants: While uncertainty about the likelihood of restrictions on access to carryover in 2020-21 were alleviated in February 2020, the policy principles will create uncertainty each year and may incentivise irrigators to favour carryover in Victoria during very dry periods.
Victorian Irrigation Development Below the Barmah Choke
In response to concerns about the potential impacts of continued permanent horticultural development in the lower Murray, the Victorian government implemented a new licence review process for 2019-20. The decision included that all licence applications in the Victorian lower Murray were to be reviewed by the Minister for Water, Lisa Neville, for 12 months, and that no new licences or limit increases were to be granted if they resulted in increased risks for the environment or entitlement holders. The process is in place until a project on the drivers of delivery risks in the system is finalised. The delivery shortfall project is still underway and has been expanded to involve New South Wales and South Australia, and include community consultation. At the June 2020 Ministerial Council meeting, ministers also agreed to commission a feasibility study to explore options to optimise the capacity of the Barmah Choke.
Implications for water market participants: While the licence review process remains in place, a stay on further development downstream of the Barmah Choke will alleviate some of the additional pressure that will be placed on water prices. There is also potential for new mechanisms to be proposed to help manage rationing in the event of water shortfalls.
Water Resource Plan Accreditation
All WRPs have now either been submitted for accreditation or accredited by the Federal Minister for Water. The remaining nine New South Wales surface water WRPs that were submitted to the MDBA in June 2020 are being assessed for their compliance with the Basin Plan. Once assessed, the MDBA will either recommend them for accreditation or continue negotiations with the NSW government on any non-compliance content. The process may still take several months as issues like environmental water protection and floodplain harvesting are debated.
Implications for water market participants: Negotiations about environmental protections and floodplain harvesting are likely to lengthen the assessment process for the New South Wales WRPs, further prolonging the status quo for water allocation rules in New South Wales.
New South Wales Groundwater Allocations and Extraction Limits
In May 2020, the New South Wales government issued updated groundwater allocation statements that indicated in 2020-21 some groundwater allocations would open at less than 100 per cent. On 1 July 2020, Murrumbidgee groundwater allocations opened at just 65 per cent to ensure the system remains compliant with new extraction limits which are assessed over multiple years. The new extraction limits use a five-year rolling extraction average rather than the previous three-year rolling extraction average to determine whether extraction is compliant.
Implications for water market participants: While some groundwater systems have reduced allocations, the magnitude and expected life of these reduced allocations remains unclear and could have serious market implications.
Independent Assessment of Social and Economic Conditions in the Basin
The final report from the Independent Assessment of Social and Economic Conditions in the Basin (the Sefton Inquiry), announced in April 2019, was provided to the Minister for Water, Keith Pitt, at the end of April 2020. At the time of writing (early August 2020), the Minister is yet to make the final report publicly available. This delay has frustrated communities and groups that are eagerly awaiting its release. In May, the Minister flagged that he intended to take a detailed and considered approach to the government’s response to the report, and the reports from the other major inquiries. An earlier draft report was publicly released for consultation in early April 2020. Key findings included that further work needed to be done to rebuild trust and engagement on water reform, including by increasing transparency and accountability, and strengthening the leadership capacity of the Basin. Another key recommendation was that further water reform and recovery should be appropriately paced to ensure it is commensurate with the capacity of communities to cope with changes. A greater focus on monitoring and evaluation of social and economic changes in communities was also recommended, as well as an increase in funding for disadvantaged communities.
Implications for water market participants: The findings released in the draft report align with other major inquiries, particularly the need for increased transparency. Market participants should watch for the release of the final report, as well as the Federal government’s consolidated inquiry response which may include further detail on the pace and nature of future water reform in Basin communities.
4.1 Allocation Trade Prices
Water allocation prices increase further
Annual water allocation prices have increased rapidly over the last three years, more than tripling in most zones between 2017-18 and 2019-20 (Table 1).
Although water allocation prices reached record-breaking highs in 2019-20, the percentage price growth was considerably less than in previous years. With the exception of NSW Murray (above Barmah) (see below), annual volume-weighted average prices (VWAPs) increased by between 20 per cent and 46 per cent in 2019-20 (Table 1). These increases are much less than the triple-digit price growth seen between 2017-18 and 2018-19.
Average annual prices in 2019-20 were also more variable across trading zones than previous years. This reflects trade constraint dynamics. The Barmah Choke and Goulburn to Murray trade constraints were binding for most of the year. This resulted in the price differences between upstream and downstream zones increasing. For example, the difference in annual VWAPs between Vic 6 Murray (Dart to Barmah) and Vic 7 Murray (Barmah to SA) increased from $48 per ML in 2018-19 to $145 per ML in 2019-20.
The annual VWAP for NSW Murray (above Barmah) decreased by 19 per cent compared to 2018-19. This is largely attributed to transfers associated with the Water for Fodder program, which were recorded on the NSW water register at $100 per ML. If Water for Fodder trades are removed, the annual VWAP is $434 per ML, which is 15 per cent higher than in 2018-19.
The estimated value of commercial allocation trade in major southern MDB trading zones is $538 million.
Table 1. Annual volume-weighted average allocation prices, major southern Murray- Darling Basin trading zones, 2017-18 to 2019-20
| Allocation type | VWAP 2017-18 ($/ML) | VWAP 2018-19 ($/ML) | VWAP 2019-20 ($/ML) | Change in price 2018-19 to 2019-20 (%) | Three-year change in price (2017-18 to 2019-20) (%) |
|---|---|---|---|---|---|
| Vic 1A Greater Goulburn | $103 | $374 | $511 | 37% | 395% |
| Vic 6 Murray (Dart to Barmah) | $125 | $415 | $499 | 20% | 300% |
| Vic 7 Murray (Barmah to SA) | $132 | $463 | $644 | 39% | 387% |
| NSW Murray (above Barmah) | $121 | $378 | $304 | -19% | 151% |
| NSW Murray (below Barmah) | $131 | $427 | $622 | 46% | 374% |
| NSW Murrumbidgee | $138 | $404 | $586 | 45% | 323% |
| SA Murray | $154 | $431 | $629 | 46% | 310% |
4.2 Comparison of Allocation Trade Prices
Allocation prices surge and then collapse
Water allocation prices in all trading zones started the 2019-20 water year at approximately $620 per ML on average. After a volatile 12 months, average prices closed the year at approximately $280 per ML in the Murrumbidgee (few trades in June) and approximately $200 per ML elsewhere (Figure 12).
Tight water supply conditions in the first half of the water year and irrigators rushing to secure water early in the season caused prices to rise rapidly. The highest weekly VWAPs for each of the trading zones were:
- Combined Goulburn $694 per ML (mid-January).
- Murray above Choke $658 per ML (early September).
- Murray below Choke $970 per ML (mid-November).
- Murrumbidgee $777 per ML (mid-January).
After allocation prices peaked between September 2019 and January 2020, the second half of the water year was characterised by the largest price decrease recorded in any water year since 2009-10 when the Millennium drought broke (decrease of 74 per cent).
Water allocation prices ended the year more than 60 per cent lower than they started. The price collapse reflected timely in-crop rainfall, market optimism buoyed by successive rainfall outlooks indicating a return to wetter than average conditions, and an early turnaround in storage levels.

Figure 12. Weekly volume-weighted average allocation prices, major southern Murray-Darling Basin trading zones, 2019-20
Source: Aither, 2020. Based on Victorian, New South Wales and South Australian water registers, 2020.

Figure 13. Weekly transfer volumes (within and into), major southern Murray-Darling Basin zones, 2019-20
Source: Aither, 2020. Based on Victorian, New South Wales and South Australian water registers, 2020.
4.3 Allocation Trade Activity
Water for Fodder program influenced net trade dynamics
In 2019-20, Vic 7 Murray (Barmah to SA) was a very large net exporter of water allocations, while SA Murray was a major recipient of transferred water (Table 2). This analysis includes all water transfers, including those recorded on water registers at $0 and other non-commercial transactions (such as environmental or carryover transfers), which can be substantial in volume.
To estimate commercial water allocation trade activity, Aither presents transfer numbers and volumes, excluding $0 transfers (Table 3). This analysis shows that in 2019-20, Vic 7 Murray (Barmah to SA) was a major recipient of water allocations transferred to commercial buyers.
Unlike previous years, Vic 1A Greater Goulburn and Vic 6 Murray (Dart to Barmah) were also net importers of commercial water allocation transfers (Table 3). These reversals in net trade can be attributed to the Water for Fodder (WFF) program which led to the transfer of approximately 40,000 ML of water allocation from SA Murray to upstream southern MDB systems. The net change volumes presented in Table 3 broadly align with the volumes allocated to these systems under the WFF program (Department of Agriculture, Water and Environment 2020).
- Vic 1A Greater Goulburn received the highest volume of transfers under the program, 13,150 ML.
- Vic 6 Murray (Dart to Barmah) received 4,700 ML.
Table 2. Allocation transfer numbers and volumes, major southern Murray-Darling Basin trading zones (all reported trades) 2019-20
| Trading Zone | Within
| Into
| Out of
| Net Change (ML) | |||||||||
|---|---|---|---|---|---|---|---|---|---|---|---|---|---|
| Vic 1A Greater Goulburn | 5,802 | 726,490 | 1,240 | 155,777 | 954 | 208,367 | -52,590 | ||||||
| Vic 6 Murray (Dart to Barmah) | 1,332 | 185,192 | 415 | 71,027 | 1,369 | 119,028 | -48,001 | ||||||
| Vic 7 Murray (Barmah to SA) | 5,816 | 742,456 | 3,540 | 464,361 | 1,036 | 956,000 | -491,639 | ||||||
| NSW Murray | 971 | 168,275 | 1,005 | 267,231 | 920 | 234,153 | 33,078 | ||||||
| NSW Murrumbidgee | 1,140 | 310,666 | 203 | 63,386 | 439 | 196,444 | -133,058 | ||||||
| SA Murray | 1,020 | 347,953 | 477 | 841,427 | 1,603 | 128,555 | 712,872 | ||||||
| Total | 16,081 | 2,481,032 | 6,880 | 1,863,208 | 6,321 | 1,842,548 | |||||||
Table 3. Allocation transfer numbers, major southern Murray-Darling Basin trading zones (excluding $0 transfers) 2019-20
| Trading zone | Within
| Into
| Out of
| Net change (ML) | |||||||||
|---|---|---|---|---|---|---|---|---|---|---|---|---|---|
| Vic 1A Greater Goulburn | 4,021 | 203,979 | 898 | 50,252 | 473 | 34,857 | 15,396 | ||||||
| Vic 6 Murray (Dart to Barmah) | 908 | 56,244 | 233 | 19,832 | 128 | 13,227 | 6,604 | ||||||
| Vic 7 Murray (Barmah to SA) | 3,862 | 307,694 | 1,535 | 173,926 | 553 | 58,834 | 115,092 | ||||||
| NSW Murray | 533 | 65,016 | 658 | 62,144 | 625 | 124,213 | -62,070 | ||||||
| NSW Murrumbidgee | 701 | 97,223 | 123 | 12,509 | 249 | 36,747 | -24,238 | ||||||
| SA Murray | 562 | 56,167 | 318 | 50,218 | 1,436 | 95,085 | -44,867 | ||||||
| Total | 10,587 | 786,324 | 3,765 | 368,881 | 3,464 | 362,963 | |||||||
4.4 Comparison of Allocation Trade Volumes
Increased end-of-season trade volumes associated with carryover
Carryover demand in 2019-20 was high compared to 2018-19. Approximately 1,200 GL of water within NSW and Victoria was carried over into 2020-21 for consumptive use. This was a result of several factors:
- the tight water supply situation in the first half of the season prompted many permanent horticulturalists to buy carryover early.
- high prices early in the season meant annual croppers opted not to plant.
- late season allocations which increased supply.
- late season in-crop rainfall reduced late summer and autumn demand, leaving large volumes of unused allocation.
Carryover in the Murrumbidgee was particularly attractive, with NSW Murrumbidgee transfer volumes in May and June higher than at the same time in 2018-19 (Figure 14). Compared to 2018-19, consumptive carryover in NSW Murrumbidgee more than doubled.
Despite increased regulatory uncertainty about the future of the Goulburn to Murray trade rule, Goulburn transfer volumes were a lot higher in the final months of 2019-20 compared to last year (Figure 14). Compared to 2018-19, 77 per cent more water (133 GL) was carried over in Vic 1A Greater Goulburn.
In contrast, transfer volumes in Vic 7 Murray (Barmah to SA) during May and June 2019-20 were similar to 2018-19. This likely reflects that much of the carryover space was already taken earlier in the season, particularly between February and April (Figure 14). Compared to 2018-19, 61 per cent more water (116 GL) was carried over in the Victorian Murray.


4.5 Inter-Valley Trade (IVT) Constraints
Trade constraints drive price divergence
Inter-valley trade (IVT) constraints restrict the trade and transfer of water allocations between major southern MDB markets. When binding, these constraints alter the within region water supply and demand dynamics.
IVT restrictions had a large influence on allocation prices during 2019-20. The water year began with plenty of trade opportunities from upstream valleys to the lower Murray, but they only lasted several weeks (Figure 15). Although allocation prices were reasonably high in July, they were equal across trading zones (see Figure 12 above).
By early August 2019, trade opportunities from upstream valleys to the lower Murray were few and far between. These dynamics, alongside strong within-region demand in the lower Murray, created price divergences between upstream and downstream zones in the first half of the year (Figure 15).
The maximum price divergences were:
- Between the Murrumbidgee and lower Murray: $242 per ML (late October).
- Between the Goulburn and lower Murray: $307 per ML (late October).
- Between the upper Murray and lower Murray: $408 per ML (late January).
By late May 2020, upstream trade opportunities to the Murrumbidgee had also been exhausted (WaterNSW, 2020), likely due to the increased demand for carryover on NSW general security entitlements.

Figure 15. Upstream to downstream inter-valley trade opportunities during 2019-20 with weekly volume-weighted average allocation prices
Source: MDBA 2020, Victorian Water Register 2020
5.1 Entitlement Trade Activity and Prices
High reliability and high security entitlement prices continued to increase
In 2019-20, high reliability and high security water entitlement VWAPs increased by between 24 per cent and 52 per cent. NSW Murray HS entitlements reached a record high annual VWAP of $8,367 per ML. This is an aggregation of NSW zones 10 and 11, and primarily reflects the price growth of NSW 11 Murray HS entitlements (Table 4).
Price movements in 2019-20 continued the longer-term trend of increasing water entitlement values over the past three years. NSW Murray HS, NSW Murrumbidgee HS and SA Murray HS entitlements have at least doubled in price between 2017-18 and 2019-20, while price growth has been slightly less for Victorian HRWS entitlements (between 61 and 73 per cent) (Table 4).
Low reliability and general security entitlement prices softened
Following several years of sustained appreciation, prices for low reliability and general security entitlements generally decreased in 2019-20. The annual VWAP for Vic 1A Greater Goulburn LRWS decreased by 23 per cent. Vic 7 Murray (Barmah to SA) LRWS was the exception, increasing by 5 per cent during the year (Table 4). This likely reflects its attractiveness as a carryover product in the lower Murray.
Table 4. Annual transfer volumes and volume-weighted average prices, major southern Murray-Darling Basin entitlement types, 2018-19 and 2019-20
| Entitlement type | No. traded | Volume traded (ML) | Annual VWAP ($/ML)
| Annual change in price (%) | Three-year change in price (%) | |||
|---|---|---|---|---|---|---|---|---|
| Vic 1A Greater Goulburn HRWS | 639 | 29,451 | $3,628 | $4,485 | 24% | 61% | ||
| Vic 1A Greater Goulburn LRWS | 210 | 16,711 | $517 | $399 | -23% | 9% | ||
| Vic 6 Murray (Dart to Barmah) HRWS | 182 | 12,837 | $3,830 | $4,829 | 26% | 69% | ||
| Vic 6 Murray (Dart to Barmah) LRWS | 85 | 9,090 | $558 | $555 | 0% | 48% | ||
| Vic 7 Murray (Barmah to SA) HRWS | 787 | 105,568 | $4,530 | $5,620 | 24% | 73% | ||
| Vic 7 Murray (Barmah to SA) LRWS | 115 | 8,780 | $620 | $653 | 5% | 69% | ||
| NSW Murray GS | 57 | 29,547 | $1,964 | $1,835 | -7% | 35% | ||
| NSW Murray HS | 58 | 6,845 | $5,740 | $8,367 | 46% | 115% | ||
| NSW Murrumbidgee GS | 45 | 21,987 | $2,139 | $1,934 | -10% | 16% | ||
| NSW Murrumbidgee HS | 36 | 4,265 | $5,762 | $7,484 | 30% | 100% | ||
| SA Murray HS | 173 | 11,788 | $4,578 | $6,949 | 52% | 129% | ||
| TOTAL | 2,387 | 256,868 | ||||||
5.2 Comparison of Trade Prices and Volumes
High reliability and high security entitlement types
Monthly VWAPs between July 2019 and June 2020 increased by between 16 and 23 per cent for all high reliability and high security entitlement types, except Vic 1A Greater Goulburn (up 1 per cent) and Vic 6 Murray (Dart to Barmah) (down 4 per cent) (Figure 16).
Annual trade volumes for the following entitlement types decreased in 2019-20 compared to 2018-19:
- NSW Murrumbidgee HS decreased 47 per cent.
- Vic 6 Murray (Dart to Barmah) HRWS decreased 44 per cent.
- SA Murray HS decreased 37 per cent.
- Vic 1A Greater Goulburn HRWS decreased 24 per cent.
Reduced turnover for these entitlement types may reflect hesitation among market participants due to global commodity trade tensions, uncertainty about the economic implications of the COVID-19 global pandemic, and questioning about whether entitlement prices may have reached a natural peak.
Annual trade volumes for NSW Murray HS and Vic Murray 7 (Barmah to SA) increased 68 per cent and 168 per cent respectively. The increase of the latter reflects a change of ownership in a large corporate agribusiness water holding.


Low reliability and general security entitlement types
Monthly price movements between July 2019 and June 2020 for low reliability and general security entitlement types were also mixed. NSW Murray GS, NSW Murrumbidgee GS and Vic 7 Murray LRWS increased between 2 and 8 per cent, while Vic 1A Greater Goulburn LRWS and Vic 6 Murray LRWS decreased 8 and 7 per cent, respectively (Figure 17).
Annual trade volumes for NSW Murray and NSW Murrumbidgee GS entitlements in 2019-20 were similar to demand in 2018-19. However, the intra-year demand pattern was driven by the high demand for carryover space in the second half of 2019-20. Volumes traded for NSW Murray and NSW Murrumbidgee GS were considerably higher between January and June than in 2018-19, particularly in April (Figure 17).
Overall, trade in Victorian LRWS entitlement types was considerably less in 2019-20 than in 2018-19. The volume traded of Vic 1A Greater Goulburn LRWS was 39 per cent less than the volume that was traded in 2018-19. This likely reflects hesitation among market participants given the regulatory uncertainty while the Goulburn to Murray trade rule review is underway. However, there was a noticeable increase in Vic 1A Greater Goulburn LRWS trade in June 2020 compared to June 2019, consistent with the fact that carryover space was increasingly difficult to find late in the season (Figure 17).


5.3 Total Entitlement Market Size and Value
Value of southern MDB entitlements exceeds $26 billion
A large proportion of the Australian water entitlement market is contained within the southern MDB, by both entitlement on issue and value. The estimated total value of major entitlement types on issue in the southern MDB in 2019-20 is approximately $26.3 billion, based on annual VWAPs generated from state water register data (Table 5). Fair market price valuations generally differ. Environmental water holdings comprise approximately 26 per cent, or $6.8 billion, of the total value.
Reflecting rapid price increases over the past five years, Aither estimates that the combined value of major entitlement types has doubled since 2015-16, increasing from a combined value of $13.5 billion to $26.3 billion.
Table 5. Volume of entitlements on issue, annual prices and estimates of market size, major southern Murray-Darling Basin entitlement types, 2019-20
| Entitlement type | Total entitlement on issue (ML) | Environmental held entitlements (ML) | VWAP ($/ML) 2019-20 | Estimated value of entitlements on issue (million) | Estimated value of environmental entitlements (million) |
|---|---|---|---|---|---|
| Vic 1A Greater Goulburn HRWS | 982,364 | 301,061 | $4,485 | $4,406 | $1,350 |
| Vic 1A Greater Goulburn LRWS | 426,724 | 49,086 | $399 | $170 | $20 |
| Vic 6 Murray (Dart to Barmah) HRWS | 320,452 | 117,289 | $4,829 | $1,548 | $566 |
| Vic 6 Murray (Dart to Barmah) LRWS | 130,680 | 18,183 | $555 | $73 | $10 |
| Vic 7 Murray (Barmah to SA) HRWS | 937,650 | 268,028 | $5,620 | $5,269 | $1,506 |
| Vic 7 Murray (Barmah to SA) LRWS | 179,474 | 23,390 | $653 | $117 | $15 |
| NSW Murray 10 GS | 1,301,236 | 364,760 | $1,498 | $1,949 | $546 |
| NSW Murray 10 HS | 22,811 | 4,499 | $6,858 | $156 | $31 |
| NSW Murray 11 GS | 372,860 | 119,913 | $1,698 | $633 | $204 |
| NSW Murray 11 HS | 166,894 | 20,510 | $8,042 | $1,342 | $165 |
| NSW Murrumbidgee GS | 1,891,995 | 475,127 | $1,934 | $3,660 | $919 |
| NSW Murrumbidgee HS | 363,698 | 15,485 | $7,484 | $2,722 | $116 |
| SA Murray HS | 608,000 | 200,000 | $6,949 | $4,225 | $1,390 |
| Total | 7,704,838 | 1,977,329 | | $26,270 | $6,838 |
Note: In previous reports, Aither has reported the estimated value of environmental holdings based on Commonwealth environmental purchases only. In this report, total entitlement on issue and total environmental holdings data provided by the Victorian, New South Wales, and South Australian governments are used to estimate market size and value (see Aither 2020b).
5.4 Entitlement Market Turnover and Returns
Entitlement turnover rate remains steady at 4 per cent
In 2019-20, the market turnover value of major southern MDB entitlements was approximately $1.1 billion, which is a 54 per cent increase on the 2018-19 turnover value ($699 million). The increase was almost entirely driven by higher entitlement prices because the total volume transferred was only 8 per cent higher in 2019-20 than in 2018-19. This means that the turnover rate – volume traded as a proportion of the volume of entitlement on issue – in 2019-20 remained unchanged from 2018-19 at 4 percent (Table 6).
However, in December 2019, there was a large volume of unusual trade likely associated with a large corporate transaction (reported to be 89 GL). When this volume of trade is removed from the analysis, the total turnover rate decreases to 3 per cent, and the total volume transferred was 29 per cent less than in 2018-19. This single deal also influenced the higher turnover rate for Vic 7 Murray HRWS (16 per cent) compared to all other entitlement types (8 per cent or less).
Low reliability and general security entitlement types turnover rates were generally the same or lower than in 2018-19, potentially indicating that market participants recognised the value of these entitlement types for their carryover characteristics and may be holding these entitlements more tightly.
Table 6. Entitlement market turnover and returns, major southern Murray-Darling Basin entitlement types (outside irrigation corporations), 2019-20
| Entitlement type | No. traded | Volume traded (ML) | Estimated turnover value (million) | Estimated turnover (%) | Average annual gross return (%) |
|---|---|---|---|---|---|
| Vic 1A Greater Goulburn HRWS | 639 | 29,451 | $132 | 4% | 9% |
| Vic 1A Greater Goulburn LRWS | 210 | 16,711 | $7 | 4% | No allocation |
| Vic 6 Murray (Dart to Barmah) HRWS | 182 | 12,837 | $62 | 6% | 7% |
| Vic 6 Murray (Dart to Barmah) LRWS | 85 | 9,090 | $5 | 8% | No allocation |
| Vic 7 Murray (Barmah to SA) HRWS | 787 | 105,568 | $593 | 16% | 16% |
| Vic 7 Murray (Barmah to SA) LRWS | 115 | 8,780 | $6 | 6% | No allocation |
| NSW Murray GS | 57 | 29,547 | $54 | 2% | 1% |
| NSW Murray HS | 58 | 6,845 | $57 | 4% | 6% |
| NSW Murrumbidgee GS | 45 | 21,987 | $43 | 2% | 3% |
| NSW Murrumbidgee HS | 36 | 4,265 | $32 | 1% | 7% |
| SA Murray HS | 173 | 11,788 | $82 | 3% | 9% |
| Total | 2,387 | 256,868 | $1,073 | 4% |
5.5 Groundwater markets
Groundwater entitlement prices reach record highs
Groundwater entitlement prices continued their upwards trend in 2019-20, reaching record highs in three of the major southern MDB groundwater markets (Figure 18).
Since 2017-18:
- NSW Lower Murrumbidgee Deep Groundwater increased 162 per cent, from $1,780 per ML to $4,656 per ML (annual VWAPs) (noting differences between zones are not picked up in state registers).
- NSW Lower Murray Groundwater increased 217 per cent, from $772 per ML to $2,450 per ML (annual VWAPs).
NSW Lower Lachlan Groundwater is traded less frequently, but has almost doubled between 2017-18 and 2019-20.
These price increases have been driven by increased demand as irrigators seek a substitute for increasingly expensive and scarce surface water, as well as increasing demand from expanding permanent horticultural plantings in the Murrumbidgee Valley

Figure 18. Entitlement trade prices ($0 trades excluded) and volumes (bubble size), major groundwater entitlements, 2012-13 to 2019-20
Source: Aither, 2020. Based on New South Wales Water Register, 2020.
5.6 Northern MDB Markets
Entitlement prices in northern MDB markets continued to steadily rise
Entitlement prices in northern MDB markets have been steadily increasing over the last five years. The northern MDB has generally been affected by more severe drought conditions than the southern Basin. In some places, record low rainfall and inflow conditions persist. In 2019-20, storage levels were comparable to levels recorded during the Millennium drought.
Northern MDB entitlement markets are generally thinly traded. This reflects their more limited hydrological connectivity and crop diversity, and the fact that most transfers are associated with land transactions. The most active northern MDB markets are shown in Figure 19.
Due to the limited number of trades, current market prices can vary significantly from VWAPs. Nevertheless, based on 71Q licence-to-licence transfers (which tend to be unrelated to land transfers), annual VWAPs increased by between 24 per cent and 125 per cent over the last three years. The most active of the northern MDB markets shown are NSW Lachlan GS, NSW Macquarie and Cudgegong GS and NSW Gwydir GS.
Between 2017-18 and 2019-20:
- NSW Lachlan GS increased 78 per cent from $671 per ML to $1,193 per ML.
- NSW Macquarie and Cudgegong GS increased 45 per cent from $1,258 per ML to $1,824 per ML.
- NSW Gwydir GS increased 55 per cent from $2,000 per ML to $3,100 per ML.

Figure 19. Entitlement trade prices ($0 trades excluded) and volumes (bubble size) for the most active northern Murray-Darling Basin entitlement markets, 2012-13 to 2019-20 (71Q licence-to-licence transfers)
Source: Aither, 2020. Based on New South Wales Water Register 2020.
6.1 Allocation Market Outlook
A dry July, but promising rainfall outlooks
Throughout the final months of 2019-20, rainfall outlooks changed for better or worse on an almost weekly basis.
Now that the 2020-21 water year has started, conditions have been drier than average across the southern MDB (Figure 20). However, the current three-month rainfall outlook indicates that irrigators can expect wetter than average conditions between August and October (Figure 21). This is a welcome change from the outlooks at the same time last year when the drying influence of the Indian Ocean Dipole (IOD) was strengthening.
But the rains need to come to materially change the water availability conditions in 2020-21. Otherwise, water allocation prices are likely to rapidly increase as they did in 2019-20, particularly in the lower Murray.
While storage volumes in the southern MDB are still above the extreme lows during the Millennium drought (9 per cent at its lowest in April 2007), the volume in storage on the 30 June 2020 (47 per cent) was below the 20-year average of 52 per cent.

Figure 20. One-month rainfall deciles, Murray-Darling Basin, July 2020
Source: Aither, 2020. Based on Bureau of Meteorology, 2020.

Figure 21. Three-month rainfall outlook, August to October 2020 (issued 30 July 2020)
Source: Aither, 2020. Based on Bureau of Meteorology, 2020.
Consumptive water availability higher than 2019-20
2020-21 opening allocations were higher than in 2019-20 (Figure 22). This means that approximately 500 GL of additional water was allocated to major entitlement types held by consumptive users on 1 July 2020 (1,146 GL) compared to 1 July 2019 (646 GL).
While the exact volume of 2019-20 carryover is not published in a centralised manner across state governments, Aither estimates that 1,200 GL of consumptive carryover water was brought into 2020-21. This is 62 per cent more water than the volume that was carried over into 2018-19 (approximately 738 GL).
The estimated volume of carryover, plus opening season allocations, provided southern MDB consumptive users with approximately 2,350 GL of water on 1 July 2020. To put this into perspective, at the same time in 2019-20, consumptive users had access to almost 1,000 GL less water (approximately 1,385 GL of consumptive allocations and carryover).
The volume available for consumptive purposes (including consumptive carryover) has increased to 2,684 GL following allocation announcements on 3 August 2020.
With the Menindee Lakes still well below the 640 GL threshold required to trigger sharing of the resource, we anticipate that the Menindee Lakes will remain in the control of WaterNSW for the duration of the 2020-21 water year.

Figure 22.Opening water allocation determinations made to major southern Murray-Darling Basin entitlement types, 2019-20 and 2020-21
Source: Aither, 2020. New South Wales Department of Planning, Industry and Environment, 2020, Northern Victoria Resource Manager, 2020, South Australian Department for Environment and Water, 2020.
Timing of allocation increases will be crucial
As with the start of most years, in early 2020-21, allocation price spreads are large and sell-side depth on spot markets is shallow. Prices in the lower Murray are around $350 per ML, $270 in the Murrumbidgee, and around $250 in the upper Murray and Goulburn.
Despite the improved water availability conditions and outlooks compared to 12 months ago (Table 7), as we enter 2020-21, IVT constraints are already closed, and allocation prices are rising. If IVT constraints remain binding, we expect lower Murray prices to continue to rise. While large, early increases in allocations will stifle any rapid price appreciation, we anticipate that demand for allocations will remain strong in the lower Murray as permanent horticulturalists look to secure their water for subsequent years. These dynamics will likely place a natural floor in average allocation prices that is higher than historical average prices.
Upper Murray and Goulburn prices will likely ease if the trade restrictions continue and allocations keep improving. However, the influence of supply and demand on Murrumbidgee allocation prices is more difficult to anticipate. The extent to which annual croppers commit to cotton plantings when cotton prices are expected to decrease in 2020-21 may be the key determinant as to whether these irrigators are buyers or sellers in 2020-21 (ABARES 2020b).
Spring rainfall and inflows from August to October will be crucial in determining allocation price trajectories. If the rains do not come, winter croppers needing to finish off crops planted during the favourable conditions in the final months of 2019-20 will enter the market. The area planted to winter crops in 2020-21 is forecast to increase by 90 per cent in NSW, with smaller increases in Victoria and South Australia (ABARES, 2020a).
Likewise, the improved 2020-21 allocation outlooks compared to the same time last year – particularly for NSW general security entitlements – are encouraging for summer crop production decisions. Based on the current allocation outlooks, annual croppers should have increased certainty earlier in the season than in 2019-20 and may commit to planting programs.
Overall, 2020-21 is on a knife’s edge (at the time of writing in early August). If average inflows eventuate, consumptive water availability could reach 3,400 GL (Table 7, plus 1,200 GL carryover), and allocation prices above the trade constraints might return closer to historical averages (between $100 and $200 per ML). Prices will be higher in the lower Murray; how high will be influenced by when permanent horticulturalists opt to secure water for subsequent years. If it does not rain, we anticipate that allocation prices in the lower Murray will rapidly increase from current levels. However, given that there is a considerable volume of carryover water in the system, we do not expect prices to reach the same levels as 2019-20.
Table 7. Late season outlooks for 2020-21 based on inflow scenarios (as at 15 July 2020)
| | Wet | Average | Dry | Extreme Dry | Est. of consumptive water available (GL) |
|---|---|---|---|---|---|
| | See note | 50 per cent chance of exceeding | 90 per cent chance of exceeding | 99 per cent chance of exceeding | Average inflows |
| Vic Goulburn HRWS | 100% | 100% | 68% | 43% | 644 |
| Vic Murray HRWS | 100% | 100% | 48% | 20% | 858 |
| NSW Murray GS | | 30% | 7% | 2% | 357 |
| NSW Murray HS | 97% | 97% | 97% | 97% | 159 |
| NSW Murrumbidgee GS | | 45% | 22% | 14% | 638 |
| NSW Murrumbidgee HS | 95% | 95% | 95% | 95% | 331 |
| SA Murray HS | 100% | 100% | 100% | 100% | 408 |
| Total | | | | | 3,394 |
Note: Wet scenario not available for NSW general security entitlements. NSW Murray HS and NSW Murrumbidgee HS both received full allocations on 1 July 2020, so the full allocation is shown for the wet scenario.
6.2 Entitlement market outlook
How water entitlement markets respond in 2020-21 will be interesting.
On the upside, there are strong market signals that Australian agriculture will weather the COVID-19 storm well. With low exchange rates, alongside improving seasonal conditions, Australia remains attractive for investors. But the extent to which supply chains have been disrupted by COVID-19 and an increasingly uncertain global commodity trading environment is still emerging. If horticultural and other commodity prices continue to ease, we may not yet have seen the bottom for water entitlement prices.
High reliability and high security entitlement markets
The question facing market participants in 2020-21 is whether the decline in high reliability and high security water entitlement prices is a speed bump on the journey to ever increasing entitlement values or an enduring correction.
The value of these entitlements is ultimately determined by the value of the agricultural products that can be produced. While long-term commodity price outlooks appear favourable, commodity prices for higher value horticultural crops and cotton are expected to ease as lockdowns in Australia’s export markets alter demand patterns in the near term. As such, prices for high reliability and high security entitlement prices may continue to soften in 2020-21.
The ongoing regulatory uncertainty associated with the ACCC’s water markets inquiry may also reduce demand for high reliability and high security entitlement types, at least throughout the first half of 2020-21.
While market participants have not been accustomed to declining entitlement values for many years, the pullback has been relatively modest to date. If lessons have been learned from the water availability and market conditions experienced the last three years, it may only take one or two large agribusinesses opting to reduce their exposure to the spot market to reverse the recent downwards trend in high reliability and high security entitlement prices. Equally, with strong evidence of a step change in returns on leases over the last two years, there is potential for investors to seize an opportunity, return to the market and stabilise prices.
Low reliability and general security entitlement markets
After interest waned in 2019-20, especially in NSW Zone 10, we are likely to see buying pressure return for lower reliability and general security entitlement types. This reflects that NSW general security entitlements have already received allocations in July and early August, and outlooks are promising.
In light of the challenges faced by market participants in securing carryover space at the end of 2019-20, and with many permanent horticulturalists needing to secure increased volumes of water as their plantings mature, demand for low reliability and general security entitlements will likely be sustained through 2020-21. Victorian low reliability water shares, particularly those in Zone 7, will continue to be attractive. NSW general security entitlement values will be more heavily influenced by climate and water availability than other entitlement types.
6.3 Policy and regulatory influences
What is in store for the 2020-21 water year?
The sheer volume of water policy inquiries and issues raised in 2019-20 means that many of the same themes are set to continue into 2020-21. Crucially, the Federal Water Minister, Keith Pitt, has signalled that it is time for action to improve water policy and market settings. Once all inquiry recommendations have been publicly released, it is our understanding that the Federal government intends to deliver a consolidated response. Minister Pitt has committed to act on any recommendations within his Ministerial remit, while continuing to progress the Basin Plan. This will occur against a backdrop of an ongoing stalemate about how to proceed with key elements of Basin Plan implementation as was evident following the June 2020 Ministerial Council meeting.
The extent to which the intense scrutiny on water markets continues into 2020-21 will be determined in large part by whether the drought finally breaks and the specific recommendations in the final report from the ACCC’s Water Markets Inquiry.
Key developments to watch are:
- Consultation on the interim report from the ACCC Water Markets Inquiry, and the final report due in November 2020.
- The release of the Federal government’s consolidated response to the other major reviews and inquires that were a feature of 2019-20.
- The outcomes of the Goulburn to Murray trade rule review.
- Basin state co-operation to manage development in the lower Murray.
- Progress on resolving disagreement about the Sustainable Diversion Limit Adjustment Mechanism and the timeframes for delivering supply, efficiency and constraints projects intended to recover water for the environment.
- Calls for increased scrutiny of water purchasing and ownership, including the potential for foreign investors’ market activity to be subject to the Foreign Investment Review Board and progress of the NSW Constitution Amendment (Water Accountability and Transparency) bill.
- Whether the remaining NSW water resource plans are recommended for accreditation by the MDBA.
Inter-valley trade constraints likely to remain a key driver of allocation prices
Since 2017-18, IVT rules have emerged as a key regulatory driver of allocation markets. This is likely to continue through 2020-21 and beyond.
Trade to the lower Murray closed in the first few days of 2020-21, highlighting the challenges market participants in the lower Murray may face this water year. If a pattern of IVT dynamics similar to 2019-20 emerges over the coming months, price divergences between upstream and downstream zones of similar magnitude to those in 2019-20 will be a feature of 2020-21.
With trade closed from the Goulburn to the Murray, a price divergence has already emerged. With limited high-value horticulture demand in the Goulburn, if the IVT remains closed prices could drop substantially. The extent to which downward pressure is placed on Goulburn allocation prices will also be determined by the outcome of the Goulburn to Murray trade rule review. The Victorian government’s request to the MDBA to limit summer water deliveries to 40 GL indicates that any rule change will likely result in less water being traded to the Murray.
The Barmah Choke remained closed for the majority of 2019-20, suppressing water prices in the upper Murray. Only trade from the Water for Fodder (WFF) programme created small downstream trade opportunities. Pending the Federal government’s decision about implementing Round 2 of WFF, WFF trades may again be the only mechanism for opening the Barmah Choke in 2020-21. Our prediction is that a second round is unlikely, particularly in the same format as Round 1.
As noted above, how the supply and demand dynamics in the Murrumbidgee play out in 2020-21 is more difficult to anticipate at this stage of the season. If a large cotton crop is planted and allocations are low in the Murrumbidgee, the IVT dynamics may reverse again to the point where the Murray to Murrumbidgee trade limit is reached. If this happens, demand is likely to be sustained either side of the constraint, and a price divergence may not emerge. Conversely, if water scarcity is higher in the lower Murray, the export limit could be reached, and the Murrumbidgee could trade at a discount.
References
Aither (2020b) Water supply and demand in the southern Murray-Darling Basin (2020 update): An assessment of future water availability and permanent horticulture irrigation water demand. Available at <https://waterregister.vic.gov.au/about/news/321-updated-estimate-of-water-supply-and-horticulture-demand-in-the-southern-basin>
ABARES (Australian Bureau of Agricultural and Resource Economics and Sciences) (2020a). Australian crop report. Available at <https://www.agriculture.gov.au/abares/research-topics/agricultural-outlook/australian-crop-report/overview>
ABARES (Australian Bureau of Agricultural and Resource Economics and Sciences) (2020b). Natural fibres: June quarter 2020. Available at <https://www.agriculture.gov.au/abares/research-topics/agricultural-outlook/natural-fibres>
Bureau of Meteorology (2020). Climate outlooks and influences. Available at <http://www.bom.gov.au/> [Accessed 16/07/2020].
Department of Agriculture, Water and Environment (2020). Water for Fodder. Available at: <https://www.agriculture.gov.au/water/mdb/programs/basin-wide/water-for-fodder>
New South Wales Department of Planning, Industry and Environment (2020). Water allocation statements. Available at <https://www.industry.nsw.gov.au/water/allocations-availability/allocations/statements>
MDBA (Murray-Darling Basin Authority) (2020). Barmah Choke IVT data.
Northern Victoria Resource Manager (NVRM) (2020). Outlook for the 2020/21 season. Available at <https://nvrm.net.au/outlooks/current-outlook> [Accessed 17/07/2020].
WaterNSW (2020). Murray to Murrumbidgee IVT is now closed. (email notification, 26 May 2020).
Water register data
New South Wales Register (2020). Available at <https://waterregister.waternsw.com.au/water-register-frame> [Accessed 07/07/2020].
South Australian Water Register (2020). Available at <https://www.waterconnect.sa.gov.au/Water-Management/Trading-and-Markets/SitePages/Home.aspx> [Accessed 07/07/2020].
Victorian Water Register (2020). Available at <https://waterregister.vic.gov.au/> [Accessed 07/07/2020].
About Australia’s Water Markets
Background
In Australia, there are two distinct but related water markets: entitlement markets and allocation markets.
Entitlement markets enable the trading of water entitlements. Water entitlements are ongoing rights to receive an annual share of available water resources in a consumptive pool (e.g., a river system or catchment). They are analogous to a land property right, are generally secure and mortgageable in the same way, and have substantial value. Each catchment typically has a small number of entitlement ‘classes’, and generally all entitlements within a given class are homogenous.
Allocation markets enable the buying and selling of water allocations. Water allocations are the volumes of water allocated to water entitlement holders during the water year (1 July to 30 June). They are a physical good analogous to a commodity, and are extracted from water courses and applied as inputs to production or the environment. Based on the water availability and demand at a given time, the value of water allocation per unit varies (usually expressed in $ per megalitre (ML)).
There is no single national Australian water market. Rather, there are many individual markets determined by the hydrological characteristics of physical water systems. Where hydrological connectivity exists, such as in the southern Murray-Darling Basin, trade between markets or zones is possible.
ENTITLEMENT MARKETS
Purpose, use and operation
An entitlement specifies an annual volumetric share of available water resources in a given catchment or system. Entitlement holders receive their share of the available water resources as water allocations. Allocations vary from year-to-year based on rainfall, inflows, water held in storage and other factors. The entitlement market enables trade in the ongoing right to receive these water allocations. Entitlements can be held by virtually any party in any location.
The entitlement market is largely used by irrigated agricultural producers, but is increasingly being used by investors, water utilities (including urban suppliers) and environmental water holders. These users use the market to modify their long-term arrangements for facilitating production, or meeting environmental requirements, or urban demand.
State government agencies govern the operation of entitlement markets, including rules and regulations regarding how and where trade can occur. Depending on the jurisdiction, other agencies (such as land titles or property registration agencies) will be involved. Third parties (such as exchanges, brokers and conveyancers) often play a role in facilitating entitlement trade.
Key drivers of market outcomes
The value of water entitlements is largely determined by their reliability characteristics. Reliability characteristics differ across entitlement classes. Higher reliability entitlements provide larger volumes of water allocations over the long term, and more consistently provide water allocations each year than lower reliability entitlements.
Trade in entitlements is related to longer-term production decisions and the characteristics of different irrigated agricultural enterprises, including their tolerance for risk. Producers who may be expanding or contracting production drive market activity, as do market participants who hold large portfolios of entitlements such as investors or large agricultural enterprises. Purchases of water on behalf of the environment have also driven market activity in recent years.
ALLOCATION MARKET
Purpose, use and operation
The allocation market provides the ability to trade physical water between parties for use, further trade, or carryover. Allocation trade can generally only occur between parties who are in trading zones that are hydrologically connected such that water can be delivered (or substituted by other water from a shared storage).
The water allocation market is mainly used by irrigated agricultural producers (including rice, dairy, horticulture, cotton and others), and environmental water managers. Irrigators use the market to sell water excess to requirements, or buy additional water for use during dry periods or when temporarily expanding production. Environmental water holders may similarly buy or sell when they have short-term surpluses or deficits.
Similar to entitlement markets, state government regulators determine annual allocations based on entitlement characteristics (that determine priority and how much water is allocated to individuals), and market rules to manage issues such as connectivity between systems and transmission losses. State governments, either directly or via their water utilities, play a key role in facilitating allocation trade, including ensuring compliance with rules and regulations, and by approving and processing trades. Parties seeking to trade allocations may utilise intermediaries such as water exchanges and brokers.
Key drivers of market outcomes
The amount of water allocated to entitlement holders each year is a key driver of allocation market outcomes (including prices and volumes traded) because it strongly influences the total amount of water available for use or trade. When allocations are low, water is scarce and prices are high. The opposite is true when allocations are high. Allocation levels reflect broader water availability, including rainfall and inflows in relevant catchments, and volumes held in storages. Other key drivers in allocation markets include conditions in markets for irrigated agricultural products, and conditions in substitute input markets.
Download Water Markets Report Notes
Rounding errors
Irrigation corporation trade data
Carryover estimates
Data sources
Aither Entitlement Index
Table notes
Figure notes