Background
Australian water management has undergone a significant period of reform over the past three decades. The establishment of water markets has been a key component of this reform story.
Water markets are now an established part of agricultural, urban and environmental water policy, management and investment in Australia.
The Aither Water Markets Report provides an overview of current water market activity in the southern Murray–Darling Basin, compares market outcomes with recent years and comments on the future outlook.
Download the PDF here

About Aither
Our Water Market Services
We are a team of award-winning, independent water markets, policy, and infrastructure advisors.
Every day, we help businesses and governments make better decisions about scarce water resources.
We do this by providing high-quality information, insights and analysis that help our clients design and implement strategies for successfully participating in Australia’s water markets. Our team also provides policy, regulatory and infrastructure advisory services.
Whether you need custom-designed water strategies or assessments of your exposure to water-related risks and opportunities, we’ll help you make clear, informed and confident water decisions.
EXECUTIVE SUMMARY
Facts at a glance 2023-24
- Estimated value of commercial allocation trade in major southern MDB trading zones: $106 million.
- Annual average southern MDB allocation prices: $45 per ML in NSW Murray (above Barmah) to $94 per ML in SA Murray.
- Estimated value of major southern MDB entitlement on issue (including environmental and Victorian water corporation holdings): $30.4 billion.
- Aither Entitlement Index (AEI) 30 June 2024: 266 points (down 4% over 12 months).
- Value of total entitlement transfers: $603 million.
- Total volume of entitlement transfers or trades (outside of irrigation corporations): 135 GL (down 6% on 2022-23).
- Entitlement market turnover: 2%.
- Average annual high security and high reliability entitlement returns (sale of allocations): between 0.6% and 7.3%.
Summary of 2023-24
For the second consecutive year the Aither Entitlement Index (AEI) experienced negative growth, driven by continuing economic headwinds which maintained downward pressure on entitlement prices. Meanwhile, 2023-24 marked a significant shift in water policy in the Murray-Darling Basin (MDB). The passage of the Commonwealth Restoring Our Rivers Act extended the Basin Plan water recovery deadlines and enabled additional water purchases to meet water recovery targets. Key to this was the anticipation of the Commonwealth recommencing buybacks to deliver the 450 GL Sustainable Diversion Limit Adjustment Mechanism (SDLAM) target, which buoyed entitlement markets and reset price expectations. A dry start to the year combined with an El Nino forecast saw allocation prices soar, but October brought rain and prices fell, and conditions remained wet until February.
Allocation markets
- Very dry conditions from July to September drove allocation prices early in the season. High allocations to entitlements and above-average rainfall over spring and summer suppressed water demand and put downward pressure on prices. Summer rainfall triggered flash flooding in parts of the MDB.
- This combination of changing conditions and counteracting drivers i.e., dry forecasts and high-water availability meant allocation prices swung aggressively in the first half of the water year, rising approximately 200% from July to September, before falling by approximately 90% by the end of January.
- The annual volume weighted average price for allocations across the southern MDB was $76 per ML. Towards the end of 2023-24, markets trended towards $5 in some systems, although there was upward price pressure in the Goulburn and Lower Murray as market participants secured water for carryover despite a relatively high risk of spill forecast for storages.
Entitlement markets
- Prices for most high-reliability and high-security entitlements decreased in 2023-24. Irrigators, particularly wine grape producers in the lower Murray, sold entitlements to support broader business operations amid economic challenges.
- The Commonwealth government passed legislation paving the way for further government water purchases to meet its 450 GL environmental target. A key event in 2023-24 was recovering 10 GL from the NSW Murray catchment as part of the Bridging the Gap Target. This put upward pressure on Murray general security entitlement prices.
- The above two countervailing factors meant entitlement markets were volatile during the year. This created two different markets, one of softening prices among irrigators, and higher prices with Commonwealth water purchases.
Facts at a glance – Outlook
- Comparison of 2023-24 and 2024-25 opening season allocations to consumptive users (excluding carryover): 725 GL less water allocated at opening of 2024-25.
- Estimated 2024-25 total volume of water available to southern MDB consumptive users before peak irrigation season under average inflows scenario (including carryover): approximately 6,655 GL.
- Bureau of Meteorology three-month rainfall outlook (July to September) for southern MDB: neutral to above average.
- Current (early August 2024) southern MDB allocation prices: $80 to $140 per ML.
Outlook for 2024-25
The 2024-25 water year opened with high allocations to most entitlements, although the overall volume was lower compared to recent years. This indicates the potential for relatively low allocation prices, below the long-term average but higher than recent years. Should another La Niña eventuate, we could see a return to very low prices.
The Commonwealth will begin activities to deliver the Basin Plan, including those to meet its 450 GL environmental target. Water purchases (tenders etc.) will be a key dynamic influencing entitlement markets this year and beyond. The Government announced an initial 70 GL tender in July, targeting southern MDB entitlements, with additional expressions of interest announcements expected in the coming months.
Allocation markets
- If current forecasts of neutral to above-average rainfall continue (early August 2024), allocation prices could remain steady or fall in the short term. Wetter conditions may see southern MDB allocation prices between $50 – $100 per ML, while drier conditions would result in higher prices. The long-term outlook for 2025-26 will be highly influential on allocation prices from April to June.
- Downstream trade opportunities will likely remain limited. The scheduled opening of the Goulburn IVT in October and December, and demand into the Murrumbidgee will be key areas to watch.
Entitlement markets
- As part of its commitment to meeting its 450 GL environmental target, the Commonwealth has begun the process of purchasing entitlement from willing sellers, starting with 70 GL as an initial round. Two more rounds of purchasing entitlements are expected in early to mid-2025.
- This will likely put upward price pressure on general security and high reliability / high security entitlements, especially as market turnover has been reducing in recent years. This will make it more challenging for other participants to purchase entitlements.
- Access to carryover space remains a key risk management tool for irrigators that will underpin demand for these entitlements.
1.1 Introduction
Now in its eleventh year , the Aither Water Markets Report provides water market participants, advisors, investors, and policy professionals with an annual snapshot of recent water market drivers and activity in the southern connected Murray-Darling Basin (MDB) (Figure 1).
This year’s report highlights the key drivers of mixed movements in water allocation prices observed in 2023-24 compared to the previous four years including:
- The declaration of an El Niño in September, with forecasts of a dry summer, was followed by above-average rainfall, creating flash floods in some regions.
- Despite forecasts of a dry 2023-24, allocations to major southern MDB entitlements were the second highest level on record. While water levels in southern MDB storages closed the year lower than previous years, they are still relatively full.
- The dry start to 2023-24 put upward pressure on prices, but above-average rainfall followed by neutral conditions reduced allocation demand.
We also highlight the softening of prices for high reliability and high security entitlements, as irrigators sell entitlements to support wider business operations in the face of economic headwinds. At the same time, Commonwealth water purchases put upward price pressure on entitlements.
As we look ahead from August 2024 (the time of writing), our outlook for 2024-25 explores how these factors may influence water markets in the southern MDB over the next 12 months.

Figure 1. Water trading zones in the southern Murray-Darling Basin.
Source: Aither, 2024.
Note: For the purposes of this report, Aither has defined the southern MDB as comprising of the Vic Goulburn, Vic Murray, NSW Murray, NSW Murrumbidgee, and SA Murray.
Aither Entitlement Index
As Australia’s only index of its kind, the Aither Entitlement Index (AEI) provides a simple, consistent, and reliable snapshot of water entitlement performance throughout the southern MDB. The Aither Entitlement Index tracks the performance (capital value) of a group of major water entitlements across the southern MDB.
2023-24 marks the second consecutive year the AEI has fallen annually. The AEI decreased by 4% annually, similar to the 4% drop in 2022-23. This contrasts with the previous nine years, when annual growth ranged 5% – 38%.
Economic conditions throughout the year remained challenging for water market participants, putting downward pressure on entitlement prices. At the same time, the passage of the Commonwealth Restoring Our Rivers Act enabled additional water purchases, putting a floor under entitlement prices and upward price pressure.
The AEI decreased in the first half of 2023-24, reaching a low in October before recovering slightly later in the year. However, a correction in June brought it to its lowest level since October 2021 (Figure 2).
Since its inception in 2008-09, the AEI’s compound annual growth rate (CAGR) has been 6%. However, since 2015-16, when entitlement prices began to appreciate rapidly, the CAGR has been 10%.
Aither’s independent water market specialists update the AEI monthly using our in-house southern Murray-Darling Basin water asset valuations. The AEI supports better decision-making by providing irrigators, investors, banks and other water owners with a reliable benchmark to track the capital value performance of water portfolios and investments and attract new investors.

Figure 2. Aither Entitlement Index, 2008-09 to 2023-24.
Source: Aither, 2024.
| The AEI finished the year 12% below its all-time high of February 2023. |
2.1 Climatic Conditions
Variable conditions through the year, as super El Niño fizzes in summer.
Climatic conditions varied across the basin through 2023-24 (Figure 3).
From July to September, rainfall in the southern MDB was below or very much below average. The Bureau of Meteorology (BOM) declared an El Niño and positive Indian Ocean Dipole (IOD) in September 2023, with most international climate models forecasting a strong El Niño over the summer. Typically, these climate drivers reduce spring and summer rainfall for eastern Australia, driving market participants to prepare for a potential extended dry period.
By November, however, conditions had changed significantly, with almost the entire southern Basin seeing above-average to very much above-average rainfall. Rainfall continued across parts of the Basin over the summer, with the Murrumbidgee, Murray, and Goulburn seeing near-record January rainfall. Increased inflows to the Goulburn led to flash flooding in the region, affecting communities and irrigators who were still recovering from flooding just a year earlier.
From February, the lower Murray experienced dry conditions, with parts of the SA Murray receiving record-low rainfall over the last four months of the year. The Bureau declared the end of the El Niño event on 18 April 2024, with indicators returning to neutral conditions.
The Northern Basin experienced above average rainfall from January, peaking around the Border Rivers region in April.

Figure 3. Rainfall deciles for the Murray-Darling Basin, 1 July 2023 to 30 June 2024
Source: Aither 2024. Based on Bureau of Meteorology, 2024.
2.2 Storages
Strong opening storage volumes absorb larger drawdown.
Water held in southern MDB storages fell 2,142 GL from 1 July 2023 to 30 June 2024 (Figure 4). This constitutes the largest annual reduction in southern MDB storages since 2018-19. However, the volume held in storages remains high for the 2024-25 water year at 11,280 GL on 30 June 2024 (79% full).
On 1 July 2023, the volume held in major southern MDB storages was 13,422 GL – the highest start to a water year since Aither’s records began in 2000-01. From July to May, continual drawdown from major southern MDB storages saw held volumes falling to 10,771 GL by early-May. Autumn rain and upstream inflows saw southern MDB storages increase at the end of the year.
The largest drawdown by percentage was seen in the Menindee Lakes system, which fell from 1,259 GL in July to 682 GL (44% capacity) at the start of May. Inflows from the Darling-Baaka system increased late in the year, when summer and autumn rainfall in the northern Basin arrived downstream. By the end of June, the volume held in the Menindee Lakes recovered to 889 GL (57% capacity).
Compared to 1 July 2023, on 30 June 2024:
- Murray storages were 82% full (1,013 GL less).
- Lake Eildon was 88% full (293 GL less).
- Murrumbidgee storages were 74% full (479 GL less).
- Menindee Lakes were 57% full (357 GL less).

Figure 4. Volume held in storage, southern Murray-Darling Basin major headwater storages, January 2000 to June 2024.
Source: Aither 2024. Based on Bureau of Meteorology, 2024.
Note: Murray storages include Lake Hume and Dartmouth, Murrumbidgee storages include Blowering and Burrinjuck.
Note: Volumes presented are accessible storage volume. This is the volume of water that can be accessed under normal circumstances and equals the total storage volume excluding dead storage volume. See Figure Notes
2.3 Allocations
Rainfall and strong opening storage volumes see near-record allocations to major southern MDB entitlements.
The total volume allocated to major southern MDB entitlements in 2023-24 (including environmental water holdings) was the second highest on record (7,849 GL), falling just 1% short of the record volume allocated last year; 2022-23 (Figure 5).
The only major entitlement that did not see full allocation was Vic 1A Greater Goulburn LRWS, reducing total volume allocated by 101 GL. Spillable water was released into the system late in the year (to see how this influenced southern MDB markets see: Section 2.6 Implications for the market).
Vic Murray LRWS entitlement holders received full allocations for the third year. Before 2021-22, this entitlement was only allocated 5% in 2016-17.
The three-year rolling average of total water allocated to major southern MDB entitlements is now 7,763 GL (99.7% of total entitlement on issue). In the 17 years before 2021-22, average annual water allocated was 4,740 GL. Over the past three years, the rise is reflected in increased allocations to GS and LRWS entitlements from wet conditions and healthy storage levels across the southern MDB. Allocations to LRWS entitlements for a third year in a row was not something anyone would have predicted in 2020.

Figure 5. Estimated total volume of water allocated to major water entitlements in the southern Murray-Darling Basin, 2007-08 to 2023-24.
Source: Aither 2024. Based on Victorian, New South Wales and South Australian water registers, 2024.
Note: Allocations to all entitlement categories are shown, including allocations to environmental water and Victorian water corporation holdings. Excludes carryover and distributions from irrigation corporations.
Full allocations continue for the fourth year in a row.
For the fourth consecutive year, all southern MDB systems saw full entitlement allocations (excluding Goulburn LRWS), a similar trend to 2022-23 (Figure 6).
Compared to 2022-23, full allocations occurred later in the year for Vic Murray HRWS, Vic Murray LRWS and Vic Goulburn LRWS entitlement holders. It took an extra four months for Vic Murray LRWS to be fully allocated after drier conditions postponed the first allocation announcement.
NSW Murray HS, Vic Goulburn HRWS and SA Murray were fully allocated by the end of July, marking the first time all three entitlements had seen full allocations within the first month of a water year. By the end of July, allocations to major southern MDB entitlements had already reached 75% of total entitlement on issue, driven by strong opening storage volumes.
Vic 1A Greater Goulburn LRWS received allocations for just the second year on record, ending the year at 77%. Despite considerable rainfall in January, storages in the region only realised benefits later in the year, at this point, additional water was retained to secure allocations for 2024-25.
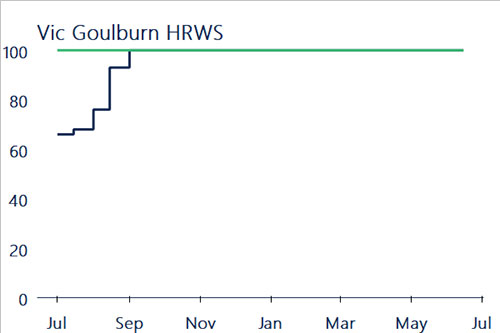
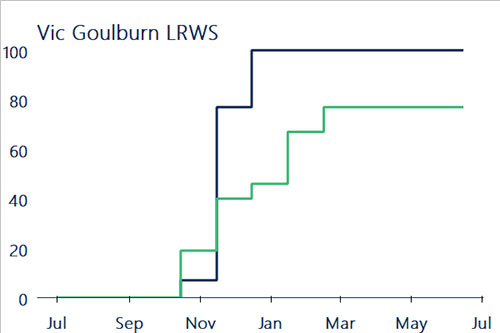
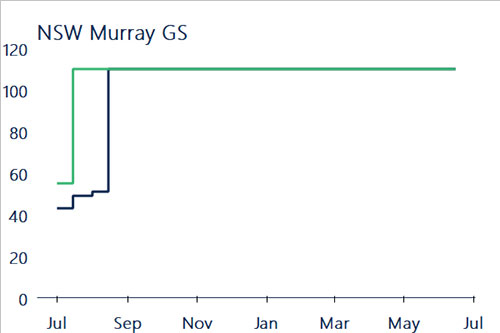
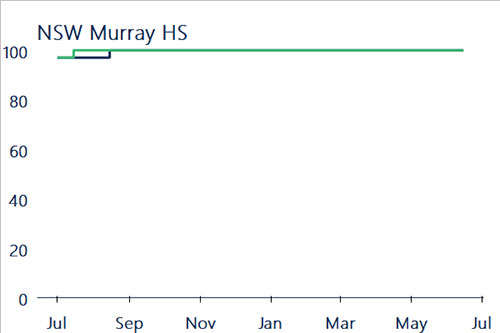
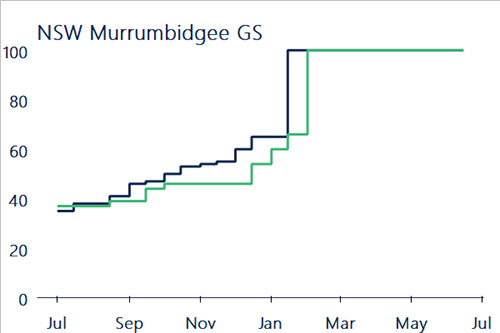
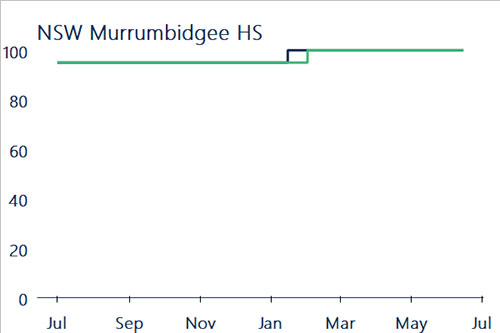
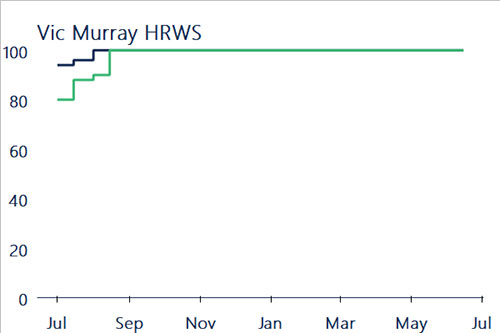
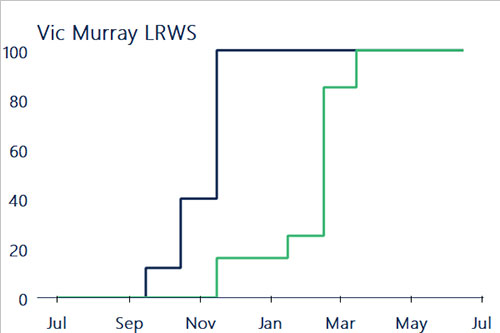

Figure 6. Water allocation determinations made to major southern Murray-Darling Basin entitlements, 2022-23 and 2023-24.
Source: Aither 2024. Based on Victorian, New South Wales and South Australian water registers, 2024.
2.4 Cropping patterns
Forecast dry conditions and strong water availability create favourable cropping conditions for southern MDB irrigators.
Dry conditions at the beginning of the year drove speculation about the start of a prolonged drought, with most major cropping areas experiencing below-average in-crop rainfall from July to September (Figure 7).
After three wet years, reduced rainfall and high-water availability encouraged annual croppers to plant large summer programs. Cotton farmers in the Murrumbidgee, Murray and Lachlan valleys hedged their bets on a productive season, planting ~80,000 Ha this water year, up 60% from 2022-23.
Rainfall increased across most of the southern Basin from November to January, with the NSW Murrumbidgee and parts of the NSW Murray system seeing sustained wet weather over the summer irrigation period.
Communities in the Goulburn region experienced flooding for the second consecutive year. Rainfall at Shepparton peaked at 139mm in January 2024, just short of the 151mm observed in October during the 2022 flood event.
Dry weather followed in February and March, as rainfall returned to at or below median levels across most major systems. Earlier in-crop rainfall ensured favourable cropping conditions for most irrigators, minimising the dry spell’s impact on markets. However, persistent dry conditions in parts of the SA Murray may restrict the area planted for some winter crops.
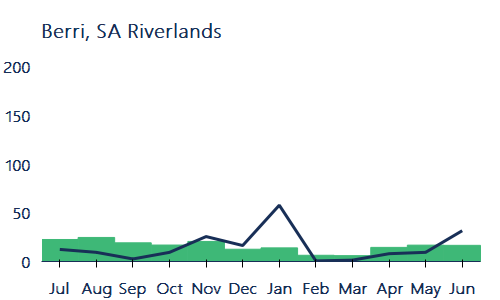
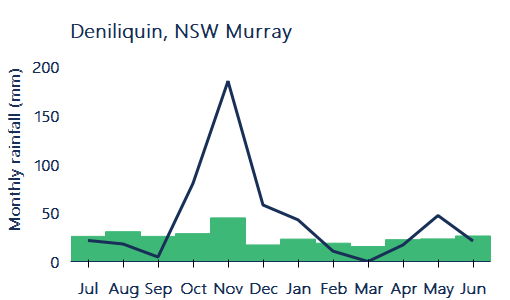
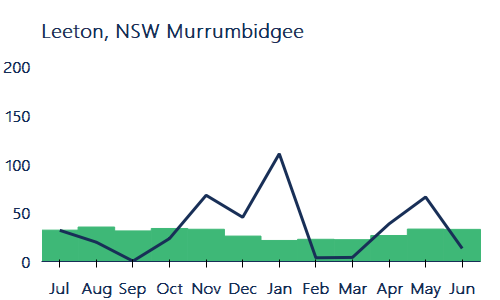
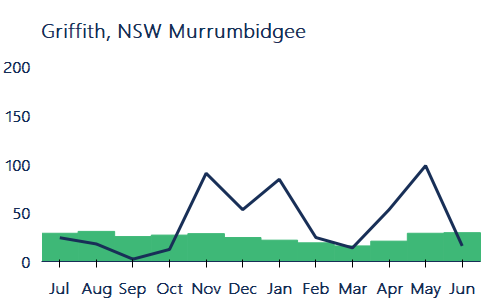
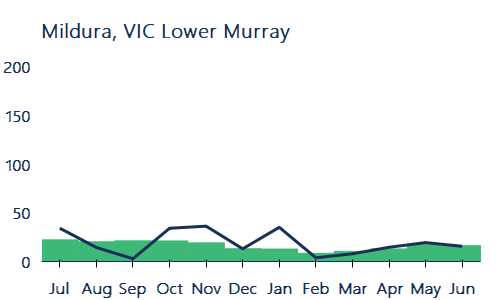
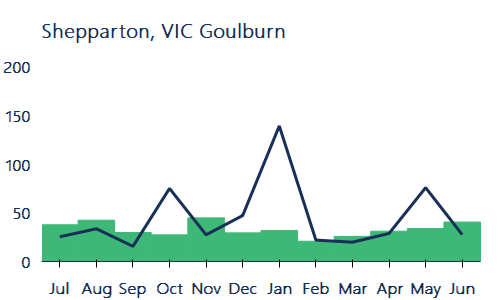

Figure 7. Monthly observed and median rainfall in southern Murray-Darling Basin annual cropping regions, 2023-24.
Source: Aither 2024. Based on Bureau of Meteorology, 2024.
Note: Time period over which median rainfall is calculated varies by location. See Figure Notes.
2.5 Demand for water
Increased usage against entitlements across all major southern MDB systems.
Total water use in major NSW and Victorian southern MDB surface water systems totalled 5,007 GL in 2023-24, an increase of 35% from 2022-23 and the highest total usage since 2017-18. High water availability and favourable planting conditions gave annual croppers confidence to plant, driving the increased demand for water.
In the Victorian Murray above the Barmah Choke, usage against entitlements was at its highest since 2015-16, at 450 GL (up 68% from 2022-23). The increase was largely driven by environmental use in the zone, up 95% from 2022-23. The Victorian Environmental Water Holder released 212 GL of environmental water into the Barmah Forest this year, more than twice as much as released in 2022-23 (102 GL).
In the NSW Murray, usage against entitlements was the second highest since 2013-14, totalling 1,062 GL (up 42% from 2022-23). Minor increases were also seen in the Murrumbidgee, where usage rose to 1,319 GL (up 15% from 2022-23). The change was driven by relatively high early-season usage in the systems, as irrigators responded to dry conditions over the first four months of the year.

Figure 8. Water usage in the Murrumbidgee, Murray (Victoria and NSW only) and Goulburn systems, 2018-19 to 2023-24.
Source: Aither 2024. Based on Victorian and New South Wales water registers, 2024.
Note: Water usage in the NSW Murrumbidgee and Murray is based on usage against HS and GS entitlements only (consumptive and environment). Water usage in the Victorian Murray and Goulburn is based on all allocation accounts with regulated trading zone sources, including water shares and bulk entitlements.
2.6 Implications for the Market
El Niño concerns drive allocation markets before summer rainfall, and record water availability limit prices across the Basin.
Despite record water availability in 2023-24, the annual southern MDB VWAP finished the year at $76 per ML, a 166% increase on 2022-23 (Figure 9).
Allocations in 2023-24 did not match 2022-23 when Vic Goulburn LRWS saw full allocations. However, a low risk of spill declaration in major northern Victorian systems saw water availability improve by 931 GL from 2022-23.
Dry conditions across the Basin, high water availability, and forecasts of a strong El Niño limiting summer rainfall combined to create a perfect storm for allocation markets in 2023-24. Annual croppers expanded plantings early in the year, confident the irrigation season would provide optimal growing conditions. Meanwhile permanent horticulturalists moved to secure water before summer conditions set in. Allocation prices increased as buyer demand rose while sellers stood aside in anticipation of higher summer prices.
However, as conditions shifted from November onwards, water availability and summer rainfall prevailed, pushing allocation prices downwards.
In June, 275 GL of spillable water was returned to the Goulburn and Campaspe accounts. Although buyers expected a downward price trend to follow, a lower-than-expected volume was brought to market. Also, carryover demand pushed prices up in the lower Murray and Goulburn till the end of 2023-24.

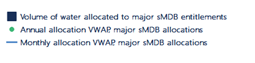
Figure 9. Annual and monthly volume weighted average prices, and total water available to major entitlements in the southern Murray-Darling Basin (including carryover), 2007-08 to 2023-24.
Source: Aither 2024. Based on Victorian, New South Wales and South Australian water registers, 2024.
Note: High Reliability / Security and Low Reliability / General Security entitlements are included for the following zones: NSW Murray 10, NSW Murray 11, NSW Murrumbidgee, Vic 1A Greater Goulburn, Vic 6 Murray, Vic 7 Murray, and SA Murray HS (Class 3). See Figure Notes.
3.1 Allocation Trade Prices
Annual prices increase across all major allocation trading zones.
Annual water allocation prices rose in the early months of 2023-24 before falling over summer. High early-season prices increased annual Volume Weighted Average Prices (VWAPs) in all major southern MDB markets, between 91% and 346% higher than annual prices in 2022-23 (Table 1).
The estimated value of total commercial trade across major southern MDB trading zones was $106 million in 2023-24, up from $28 million in 2022-23. While volumes traded rose this year, the change in value was driven by higher allocation prices.
When an El Niño was declared for 2023-24, allocation holders anticipated a steep price increase over the summer. During the last strong El Niño event in 2015-16, the annual southern MDB VWAP finished the year at $227 per ML, peaking in the lower Murray in November at over $280 per ML. Annual prices across major zones over 2023-24 were between 59% and 78% lower than those seen in 2015-16, with the climatic realities of the 2023-24 El Niño not matching the expectations of market participants.
Trade between the Murrumbidgee and lower Murray evened out over the year, with 2023-24 ending with allocation VWAPs $0 to $12 per ML higher in the lower Murray. Historically, lower Murray parcels have attracted higher prices than the Murrumbidgee, incentivising downstream trade across the Murrumbidgee IVT (when it is open). In 2021-22, where similar annual VWAPs to 2023-24 were observed, lower Murray allocation VWAPs finished the year $32-$59 per ML higher than those observed in the Murrumbidgee.
Table 1. Annual volume weighted average prices, major southern Murray-Darling Basin trading zones, 2021-22 to 2023-24.
|
Trading zone
|
VWAP 2021-22 ($/ML)
|
VWAP 2022-23 ($/ML)
|
VWAP 2023-24 ($/ML)
|
Change in price 2022-23 to 2023-24 (%)
|
Change in price 2021-22 to 2023-24 (%)
|
|---|---|---|---|---|---|
|
Vic 1A Greater Goulburn
|
$54
|
$21
|
$60
|
179%
|
10%
|
|
Vic 6 Murray (Dart to Barmah)
|
$59
|
$18
|
$57
|
218%
|
-2%
|
|
Vic 7 Murray (Barmah to SA)
|
$89
|
$33
|
$83
|
149%
|
-7%
|
|
NSW Murray (above Barmah)
|
$66
|
$24
|
$45
|
83%
|
-33%
|
|
NSW Murray (below Barmah)
|
$86
|
$24
|
$84
|
258%
|
-2%
|
|
NSW Murrumbidgee
|
$57
|
$21
|
$83
|
288%
|
45%
|
|
SA Murray
|
$116
|
$56
|
$94
|
68%
|
-19%
|
3.2 Comparison of Allocation Trade Prices
Prices rise on forecast and dry conditions, but markets tumble as rain returns to the Basin.
Prices rose across major southern MDB markets from August, peaking in September, before rains pushed prices down over summer and autumn (Figure 11). In the last week of September, the aggregated southern MDB VWAP peaked at $194 per ML, with the Murrumbidgee VWAP at $224 per ML simultaneously – the peak for any zone in 2023-24.
From November to May, allocation markets experienced consistent downward price pressures, leading to VWAPs reducing 90-98% by the end of May. After recording the highest prices of the season, the Murrumbidgee saw the lowest VWAPs at the end of the year, trading at ~$5 per ML throughout June.
The price differential between the highest and lowest weekly VWAPs in each trading zone was:
- Combined Goulburn: down $151 per ML
- Murray (above Barmah): down $131 per ML
- Murray (below Barmah): down $184 per ML
- Murrumbidgee: down $219 per ML
Last-minute demand for carryover in the Goulburn in June arrested price depreciation in both the Goulburn and the lower Murray. The Combined Goulburn VWAP rose 77% from mid-June to late June, while the lower Murray VWAP improved from $20 per ML to $43 per ML, in consecutive weeks of June.

Figure 10. Weekly volume weighted average prices, major southern Murray-Darling Basin trading zones, 2023-24.
Source: Aither, 2024. Based on Victorian, New South Wales, and South Australian water registers, 2024.

Figure 11. Weekly transfer and trade volumes (within and into), major southern Murray-Darling Basin trading zones, 2023-24.
Source: Aither, 2024. Based on Victorian, New South Wales, and South Australian water registers, 2024.
3.3 Allocation Trade Activity
Net trade into SA Murray reaches record volume.
The SA Murray continued to be the largest net importer of allocations of any major southern MDB zone in 2023-24 (+864 GL), whilst Vic 7 Murray was again the largest exporter (-664 GL). The net volume traded into/out of each zone in 2023-24 was the highest of any year in the past decade.
The analysis in Table 2 contains all water transfers, including those recorded on water registers at $0 and other non-commercial transactions (such as environmental transfers); these can be substantial and can increase overall trade volumes. Estimates of commercial water allocation trade activity are made by excluding $0 transfers (Table 3).
Of the 918 GL transferred into the SA Murray in 2023-24, 752 GL was $0 environmental trade (confirmed by the South Australian Department of Environment and Water). 330 GL of the 918 GL occurred in September, December and June, in part driven by South Australia’s quarterly balancing requirements. No trades were recorded in March due to changes to the SA Water Register.
Vic 1A Greater Goulburn was a net exporter when including $0 trades, with the change being driven by 182 GL of $0 related party trade passing over the Goulburn IVT into the lower Murray. However, demand for carryover saw the Goulburn become a net importer of priced trade. In the last month of the year alone, 36.6 GL of priced trade came into the zone as entitlement holders scrambled to secure water for 2024-25.
Table 2. Allocation transfer numbers and volumes, major southern Murray-Darling Basin trading zones (all reported trades) 2023-24.
|
Trading Zone
|
Within
|
Into
|
Out of
|
Net Change (ML)
|
|||||||||
|---|---|---|---|---|---|---|---|---|---|---|---|---|---|
|
Vic 1A Greater Goulburn
|
4,405
|
1,031,650
|
1,108
|
238,754
|
756
|
351,953
|
-113,198
|
||||||
|
Vic 6 Murray (Dart to Barmah)
|
1,337
|
353,640
|
87
|
19,932
|
181
|
106,192
|
-86,260
|
||||||
|
Vic 7 Murray (Dart to Barmah)
|
4,849
|
938,330
|
898
|
383,418
|
1,020
|
1,047,381
|
-663,963
|
||||||
|
NSW Murray (above Barmah)
|
159
|
298,093
|
81
|
35,932
|
41
|
36,294
|
-362
|
||||||
|
NSW Murray (below Barmah)
|
1,093
|
216,477
|
292
|
133,346
|
419
|
175,431
|
-42,085
|
||||||
|
NSW Murrumbidgee
|
1,293
|
826,419
|
246
|
93,945
|
158
|
88,392
|
5,553
|
||||||
|
SA Murray
|
751
|
326,275
|
444
|
918,075
|
177
|
53,602
|
864,473
|
||||||
|
Total
|
13,887
|
3,990,884
|
3,156
|
1,823,403
|
2,752
|
1,859,245
|
|||||||
Table 3. Allocation transfer numbers and volumes, major southern Murray-Darling Basin trading zones (priced trades, i.e., excluding $0 transfers) 2023-24.
|
Trading zone
|
Within
|
Into
|
Out of
|
Net change (ML)
|
|||||||||
|---|---|---|---|---|---|---|---|---|---|---|---|---|---|
|
Vic 1A Greater Goulburn
|
3,170
|
331,794
|
821
|
101,798
|
439
|
60,113
|
41,684
|
||||||
|
Vic 6 Murray (Dart to Barmah)
|
1,077
|
166,976
|
36
|
2,849
|
45
|
17,861
|
-15,013
|
||||||
|
Vic 7 Murray (Dart to Barmah)
|
3,733
|
516,473
|
451
|
74,765
|
748
|
136,347
|
-61,582
|
||||||
|
NSW Murray (above Barmah)
|
88
|
40,989
|
45
|
19,452
|
4
|
1,571
|
17,881
|
||||||
|
NSW Murray (below Barmah)
|
782
|
119,516
|
193
|
45,637
|
259
|
54,626
|
-8,989
|
||||||
|
NSW Murrumbidgee
|
1,049
|
414,228
|
165
|
36,234
|
114
|
41,074
|
-4,840
|
||||||
|
SA Murray
|
379
|
59,841
|
306
|
76,398
|
68
|
16,394
|
60,003
|
||||||
|
Total
|
10,278
|
1,649,817
|
2,017
|
357,132
|
1,677
|
327,987
|
|||||||
3.4 Comparison of allocation market activity
Allocation markets start the year strong before going quiet to start 2024.
Markets were active over the first half of 2023-24, with volume traded or transferred up from 2022-23 in most trading zones, before record rainfall and water availability limited demand across the southern Basin (Figure 12). The first half of 2023-24 saw 876 GL more market activity than the first six months of 2022-23. This was focused in the SA Murray and NSW Murrumbidgee.
After the wettest December in the Basin in six years, January saw near-record rainfall, resulting in especially quiet allocation markets that month. The volume traded or transferred in January across major southern Basin markets was 121 GL less than that traded or transferred in January 2023.
No trade was recorded on the South Australian Water Register for March; as a result, no recorded trade activity was calculated. At the end of February, the Department of Environment and Water (DEW) began transitioning to its new water register. The transition process delayed the recording of trades approved in March, which are now represented in later months’ data.
The total volume traded or transferred in the SA Murray in 2023-24 was 30% greater than that of the last water year, at 1,244 GL. Only Vic 7 Murray (1,321 GL) and Vic 1A Goulburn (1,270 GL) saw greater trade activity.
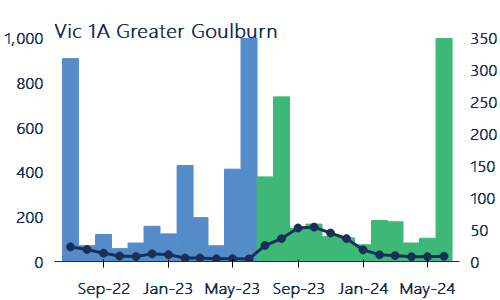
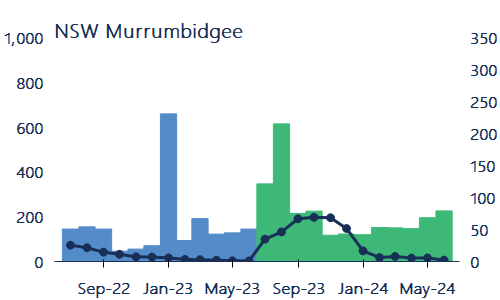
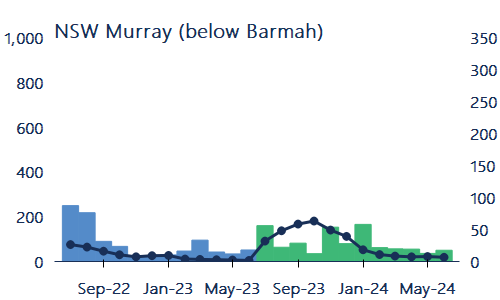
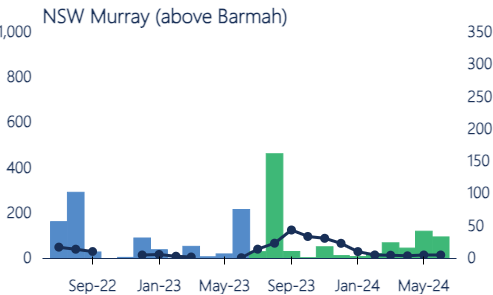
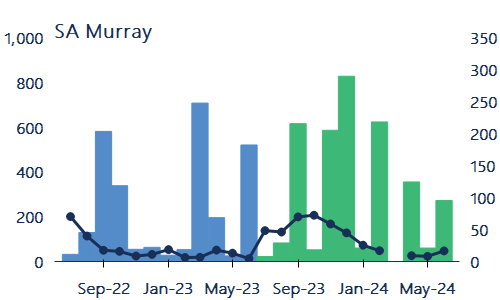
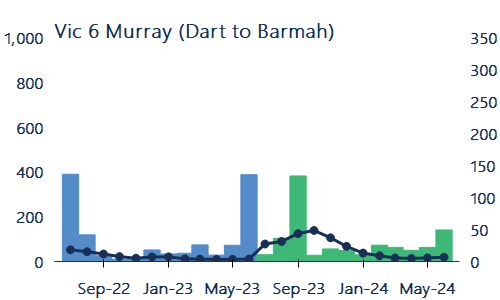
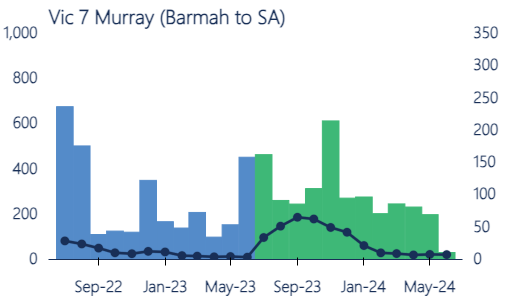

Figure 12. Monthly volume weighted average prices, and transfer and trade volumes (within and into), major southern Murray-Darling Basin trading zones, 2022-23 to 2023-24.
Source: Aither, 2024. Based on Victorian, New South Wales, and South Australian water registers, 2024.
3.5 Trade constraints
Trade opportunities closed for most of the year.
Trade constraints limit moving water allocations between southern MDB markets. This can alter water supply and demand dynamics within and between regions, driving price differences between trading zones.
The Goulburn IVT, as prescribed by the Goulburn to Murray trade rule, had three openings in 2023-24, totalling:
- 1 July: 59 GL
- 15 October: 90 GL
- 15 December: 12 GL
From 15 December onwards, trade across the IVT is only allowed when backtrade between the Murray and Goulburn happens. In March 2023, backtrade occurred after prices in the Goulburn rose slightly above those in the lower Murray due to dry conditions. This incentivised backtrade, opening the IVT. The IVT also opened in the final days of the month as carryover demand in the Goulburn rose sharply.
The opening trade opportunity for the Barmah Choke on 1 July 2023 was 60.6 GL, the highest opening balance since the trade rule was implemented in 2014. Trade across the choke was limited for a portion of the year, due to the trade restriction between NSW and Victoria.
The largest price differential between zones separated by IVTs were:
- Goulburn to Lower Murray (Goulburn IVT): $68
- Upper Murray to Lower Murray (Barmah Choke): $87
- Murrumbidgee to Lower Murray (Murrumbidgee IVT): $64


Figure 13. Upstream to downstream trade opportunities (end-of-day) during 2023-24 with weekly allocation volume weighted average prices showing price divergence and equalisation.
Source: Aither, 2024. Based on Victorian and New South Wales water registers, 2024. MDBA 2024, Victorian Water Register 2024
3.6 Reasons for Trade
South Australia now reports trade purposes.
This year marked the beginning of the SA government beginning to report trade purposes for allocation trades in line with NSW and Victoria.
Across all three states, a purpose was listed for 99% of priced commercial trade volume (2022-23: 99%) and 97% of the $0 trade volume (2022-23: 79%). Figure 14 shows the monthly volume of priced and $0 allocation transfers or trades by reason.
Trade with a reported purpose of “Other” constituted 16% of the $0 volume traded or transferred, totalling 377 GL in August and September alone. Of that volume, 99% (374 GL) was environmental trade in Victoria.
The priced trade volume in 2023-24 was comprised of:
- 77% standard commercial trade (69% last year),
- 10% delivery of allocations under forward contracts and entitlement leases (13% last year),
- 9% carryover parking (13% last year).
The $0 trade volume in 2023-24 was comprised of:
- 35% related party trade (48% last year),
- 32% environmental use and other trade (23% last year),
- 3% carryover parking return (4% last year).
All three Basin states now report trade purposes, improving market transparency. We expect information provided in future years to help market participants better understand the nature of individual trades.


Figure 14. Volume traded by purpose of trade in major southern MDB trading zones, 2023-24.
Source: Source: Aither, 2024. Based on Victorian and New South Wales water registers, 2024.
Note: Data includes trades and transfers into and within NSW Murray (above Barmah), NSW Murray (below Barmah), NSW Murrumbidgee, Vic 1A Greater Goulburn, Vic 6 Murray (Dart to Barmah) and Vic 7 Murray (Barmah to SA). Data excludes irrigation corporation trade and transfers.
Note: Victoria uses 8 categories; NSW uses 12, and SA uses 6 categories. All categories are reported.
3.7 Allocation trade activity in the Murray (above the Barmah Choke)
Murray (above Barmah Choke) allocation trade activity increased by 67% compared to 2022-23.
Data for water market trade activity in irrigation corporations is important. It enables market participants to build a more complete picture of trade activity compared with just state water register data.
Although data on irrigation corporation trade activity is limited, Murray Irrigation Limited provide aggregated daily water allocation sales data on its website. Continuing from the last two water years, Aither combined this data with data from the NSW and Victorian water registers to show what happened in the upper Murray in 2023-24.
The total volume traded in the upper Murray in 2023-24 was 498 GL, a 67% increase on the 298 GL traded in 2022-23 and a 29% increase on the 354 GL traded in 2021-22.
Trade activity peaked in September, when the total volume traded or transferred was over 66 GL, almost four times that in September 2022. More than two-thirds of the traded volume was commercial trade in the Victorian upper Murray, with the dry start to the year leading participants to secure their water needs early.

Figure 15. Monthly allocation transfer and trade volumes, NSW and Victorian Murray (above Barmah) 2023-24.
Source: Aither, 2024. Based on NSW and Victorian water registers. Murray Irrigation Limited website, 2024.
Note: Volumes from the NSW and Victorian water registers include all volumes transferred or traded (within and into zones 6 and 10).
4.1 Entitlement trade prices
Annual entitlement VWAPs for prices saw mixed movements in 2023-24.
Continuing challenging economic conditions saw annual VWAPs (based on state water register data) for most high reliability and high security entitlements fell in 2023-24. NSW Murray 10 HS was the exception, up 1%, although only 2 trades were recorded in 2023-24. The most significant falls were in lower Murray entitlements, with SA Murray HS down 12% and Vic 7 HRWS down 9%.
This softening reflects irrigators, especially wine grape producers in the lower Murray, selling entitlements to support broader business operations in the face of economic headwinds, including inflation, rising interest trades and the impact of trade restrictions with China.
Low reliability entitlement prices generally remained steady, reflecting continued demand for these entitlements and their ability to carryover water between years.
General security entitlement prices increased, with a major lift for NSW Murray 10 GS (up 7%). This was driven by Commonwealth water purchases towards the Bridging the Gap target. The Commonwealth recovered 10 GL from the NSW Murray catchment in 2023-24 to meet local targets.
A note on VWAPs and water purchases
The register VWAPs do not tell the whole story; several trades recorded on water registers in the last six months relate to buyback purchases agreed in November 2023. These transactions affect the prices for NSW Murray entitlements, which is why they increased when most other entitlements fell.
Table 4. Annual transfer volumes and volume weighted average prices, major southern Murray-Darling Basin entitlements, 2022-23 and 2023-24.
|
Entitlement
|
No. traded 2023-24
|
Volume traded (ML) 2023-24
|
Annual VWAP ($/ML)
|
Annual change in price 2022-23 to 2023-24 (%)
|
Change in price 2021-22 to 2023-24 (%)
|
|||
|---|---|---|---|---|---|---|---|---|
|
Vic 1A Greater Goulburn HRWS
|
713
|
30,267
|
$4,125
|
$3,975
|
-3.6%
|
-3%
|
||
|
Vic 1A Greater Goulburn LRWS
|
370
|
19,874
|
$870
|
$881
|
1%
|
38%
|
||
|
Vic 6 Murray (Dart to Barmah) HRWS
|
127
|
6,190
|
$4,998
|
$4,583
|
-8%
|
-7%
|
||
|
Vic 6 Murray (Dart to Barmah) LRWS
|
80
|
3,107
|
$850
|
$779
|
-8%
|
17%
|
||
|
Vic 7 Murray (Barmah to SA) HRWS
|
675
|
18,929
|
$7,839
|
$7,132
|
-9%
|
0%
|
||
|
Vic 7 Murray (Barmah to SA) LRWS
|
130
|
5,198
|
$1,817
|
$1,878
|
3%
|
9%
|
||
|
NSW Murray 10 GS
|
8
|
2,049
|
$1,650
|
$1,760
|
7%
|
5%
|
||
|
NSW Murray 10 HS
|
2
|
310
|
$7,300
|
$7,365
|
1%
|
No trade recorded in 2021-22
|
||
|
NSW Murray 11 GS
|
28
|
2,390
|
$2,766
|
$2,873
|
4%
|
20%
|
||
|
NSW Murray 11 HS
|
76
|
11,112
|
$9,357
|
$9,068
|
-3%
|
2%
|
||
|
NSW Murrumbidgee GS
|
35
|
18,252
|
$2,610
|
$2,463
|
-6%
|
0%
|
||
|
NSW Murrumbidgee HS
|
11
|
4,227
|
$9,109
|
$8,745
|
-4%
|
6%
|
||
|
SA Murray HS
|
190
|
12,909
|
$8,268
|
$7,259
|
-12%
|
-3%
|
||
|
TOTAL
|
2,445
|
134,815
|
||||||
Note: Volume weighted average prices generated from state water register trade data may differ from market values. See notes section for further details.
4.2 Comparison of trade prices and volume
High reliability and high security entitlements.
Monthly register VWAPs between July 2023 and June 2024 saw a downward trend across HRWS and HS entitlements. These are based on state water register data, which can often lag market prices. Market activity was overall lower than 2022-23 (down 11%) (Figure 16).
During 2023-24, monthly VWAPs fell for most major HRWS and HS entitlements between July 2023 and June 2024. The largest falls were for SA Murray HS (down 20%), Vic 6 Murray HRWS (down 16%) and Vic 7 Murray HRWS (down 14%). Trade or transfer volumes decreased 51% for Vic 7 Murray HRWS and 39% for Vic 6 Murray HRWS compared to 2022-23. An exception was SA Murray HS, which was up 68% for the same period.
Monthly VWAPs for NSW Murray 11 HS remained relatively steady at around $9,000 per ML in 2023-24. Trade and transfer activity doubled from 2022-23 (5 GL to 11 GL), although this was driven by four trades totalling 5 GL. This reflects limited market activity for this entitlement and was similar for NSW Murray 10 HS, with only two trades recorded in 2022-23.
A similar trend was also seen for NSW Murrumbidgee HS, with monthly VWAPs generally around $8,800 per ML for most of 2023-24, except in June 2024 ($8,200 per ML). Market activity was up 42% (1.2 GL) from 2022-23, although three larger $0 transfers drove this.
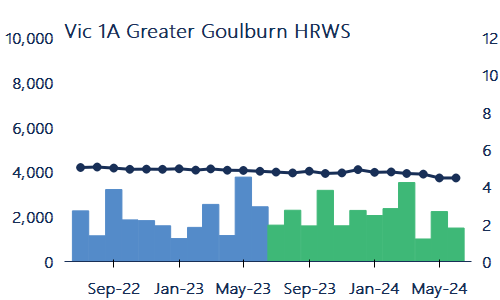
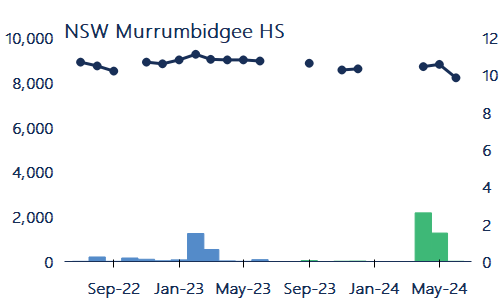
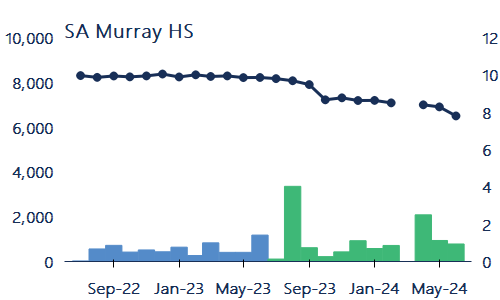
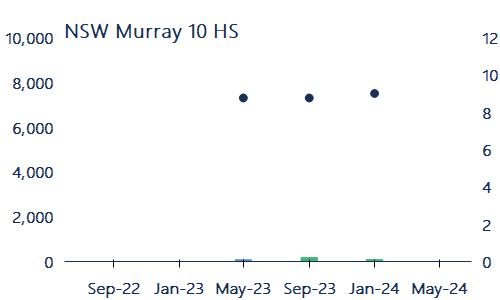
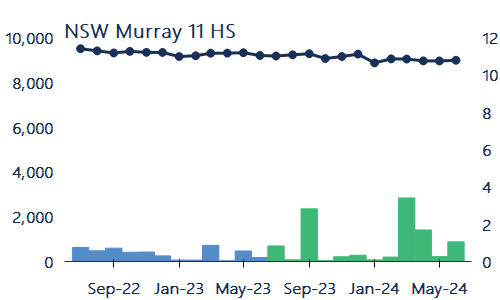
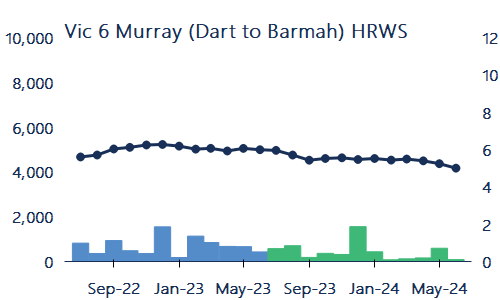
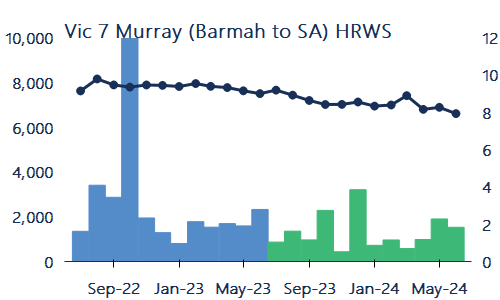
Figure 16. Monthly volume weighted average prices and transfer volumes (within and into), major southern Murray-Darling Basin high reliability and high security entitlements, 2022-23 to 2023-24 (based on water register data)
Source: Aither, 2024. Based on Victorian, New South Wales and South Australian water registers, 2024.
Left axis- Volume weighted average price ($/ML)
Right axis – Volume of water traded (GL)
Low reliability and general security entitlements.
Monthly register VWAPs generally remained steady or increased through 2023-23, and are based on state water register data, which often lag market prices. Vic 7 Murray LRWS and Vic 1A Goulburn LRWS had the biggest increases, up 17% and 9% respectively between July 2023 and June 2024 (Figure 17). This shows continued interest in secure carryover space. Monthly VWAPs for Vic 6 Murray LRWS were an exception, $800 – $900 per ML for most of 2023-24.
Trade and transfer activity for the above entitlements was down around 50% from 2022-23, except for Vic 1A Goulburn LRWS, which remained steady (down only 3%).
Monthly VWAPs for NSW Murray 11 GS were up 6% between July 2023 and June 2024, with trade and transfer activity down 52% from 2022-23. A similar increase of 5% was seen for NSW Murray 10 GS VWAPs from August 2023, with market activity down from 2022-23. However, when related party trades are removed, activity increases from 100 ML in 2022-23 to 2,031 ML in 2023-24.
Monthly VWAPs for NSW Murrumbidgee GS remained steady, down 0.5% between July 2023 and June 2024. Market activity (once $0 trades are excluded) was down 26% from 2022-23.
The above changes indicate ongoing interest in general security entitlements, driven by speculation of an imminent Commonwealth buyback program following the passage of the Restoring Our Rivers Act.
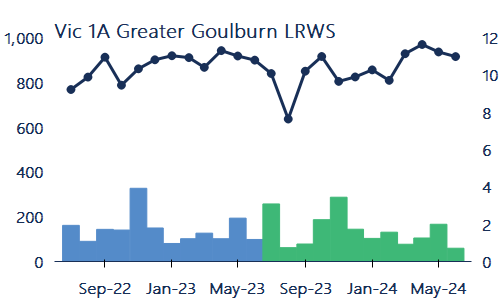
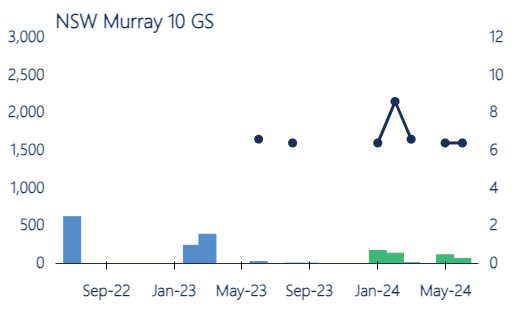
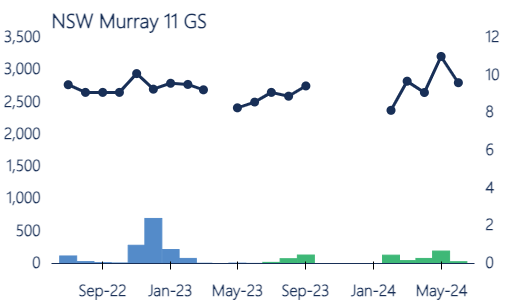
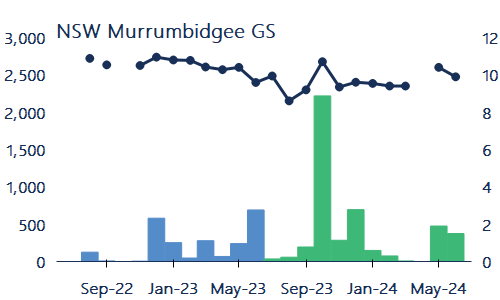
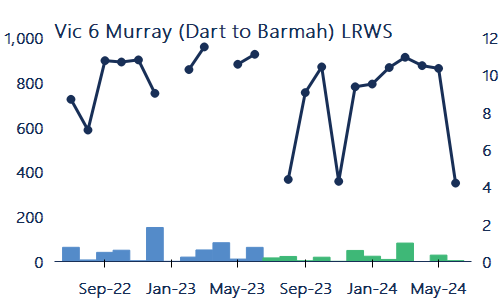
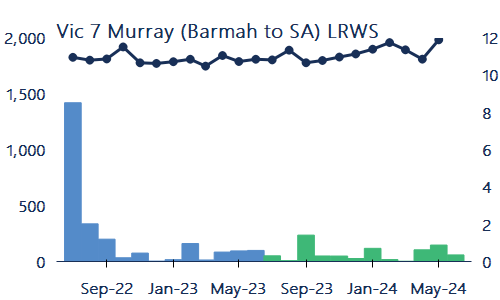
Figure 17. Monthly volume weighted average prices and transfer volumes (within and into), major southern Murray-Darling Basin low reliability and general security entitlements, 2022-23 to 2023-24.
Source: Aither, 2024. Based on Victorian, New South Wales and South Australian water registers, 2024.
Note: Price axes differ across the charts above, reflecting the general price differences between entitlements.
Left axis- Volume weighted average price ($/ML)
Right axis – Volume of water traded (GL)
4.3 Total entitlement market size and value
The value of southern MDB entitlements falls 6% from last year’s all-time high to $30 billion.
The majority of water entitlement trading in Australia occurs in the southern MDB. In 2023-24, the estimated total value of major entitlements on issue in the southern MDB fell 6% or $2 billion from 2022-23 ($32 billion).
The estimated market value in 2023-24 was approximately $30.4 billion (Table 5). This estimate is based on state water register data which often lags market prices. The AEI considers current market data and shows similar results with a 4% decline in value.
With total entitlement on issue largely unchanged in 2023-24, 36% of the decrease was driven by lower annual VWAPs for Vic 7 Murray HRWS, followed by SA Murray HS (32%) and NSW Murrumbidgee GS (14%). This was likely driven by softening economic conditions, especially among wine grape producers in the lower Murray.
The decrease in the value of entitlements on issue from 2022-23 follows an increase in the previous year (+8%) to an all-time high, and a decade of increasing values. Since Aither first estimated the value of entitlements on issue in the 2014-15 Aither Water Markets Report, this is the first year of a decline in annual values.
The estimated value of environmental water holdings in the southern MDB decreased by 4% from 2022-23. In 2022-23, environmental water holdings represent around $7.9 billion, or 26% of the total value of entitlements on issue.
Table 5. Volume of entitlements on issue, annual prices and estimates of market size, major southern Murray-Darling Basin entitlements, 2023-24.
|
Entitlement type
|
Total estimated entitlement on issue (ML)
|
Estimated environmental held entitlements (ML)
|
VWAP ($/ML) 2023-24
|
Estimated value of entitlements on issue (million)
|
Estimated value of environmental entitlements (million)
|
|---|---|---|---|---|---|
|
Vic 1A Greater Goulburn HRWS
|
1,010,050
|
302,160
|
$3,975
|
$4,015
|
$1,201
|
|
Vic 1A Greater Goulburn LRWS
|
443,320
|
49,090
|
$881
|
$390
|
$43
|
|
Vic 6 Murray (Dart to Barmah) HRWS
|
326,770
|
117,340
|
$4,583
|
$1,498
|
$538
|
|
Vic 6 Murray (Dart to Barmah) LRWS
|
135,510
|
18,180
|
$779
|
$106
|
$14
|
|
Vic 7 Murray (Barmah to SA) HRWS
|
945,690
|
268,030
|
$7,132
|
$6,745
|
$1,912
|
|
Vic 7 Murray (Barmah to SA) LRWS
|
184,750
|
23,390
|
$1,878
|
$347
|
$44
|
|
NSW Murray 10 GS
|
1,301,236
|
364,760
|
$1,760
|
$2,290
|
$826
|
|
NSW Murray 10 HS
|
22,811
|
4,499
|
$7,365
|
$168
|
$33
|
|
NSW Murray 11 GS
|
372,860
|
119,913
|
$2,873
|
$1,071
|
$344
|
|
NSW Murray 11 HS
|
166,894
|
20,510
|
$9,068
|
$1,513
|
$186
|
|
NSW Murrumbidgee GS
|
1,892,005
|
478,391
|
$2,463
|
$4,660
|
$1,156
|
|
NSW Murrumbidgee HS
|
364,573
|
16,066
|
$8,745
|
$3,187
|
$133
|
|
SA Murray HS
|
608,000
|
207,000
|
$7,259
|
$4,413
|
$1,503
|
|
Total
|
7,774,468
|
1,989,329
|
|
$30,404
|
$7,932
|
Note: Volume weighted average prices were generated using data reported on the state-based water registers; market values may differ.
Note: In reports prior to 2019-20, Aither reported the estimated value of environmental holdings based on Commonwealth environmental purchases only. Since this period, Aither has used an estimate of the environmental entitlement on issue for major entitlements in the southern MDB. See Table Notes section for further details about data sources.
4.4 Entitlement market turnover and returns
Market turnover has decreased to its lowest level since 2009-10.
Market turnover is the volume traded or transferred as a proportion of the estimated consumptive entitlement on issue. For major entitlements in the southern MDB, market turnover in 2023-24 varied between 0.2% and 8% (average of 2%) (Table 6).
Compared to 2022-23, the number of trades decreased by 6%, while the total volume traded or transferred decreased by 13% to its lowest level since 2009-10. Since 2009-10, annual trades and transfer volumes have averaged 293 GL.
The decrease in market turnover was mainly driven by Vic 7 Murray HRWS and Vic 7 Murray LRWS, which saw decreased trade or transfer volumes (down 51% and 66%, respectively, from 2022-23).
The market turnover value for major southern MDB entitlements in 2023-24 was around $603 million, a 16% decrease from 2022-23, when it was $718 million (Table 6). This has been driven by reducing trade volumes and softening entitlement prices in 2023-24. Since the 2019-20 peak of $1.1 billion, three of the last five years have seen decreasing turnover values.
A combination of lower entitlement annual VWAPs and higher allocation prices meant that returns to all entitlements in 2023-24 were higher compared to 2022-23. Vic 6 Murray LRWS saw the biggest increase in returns, up from 2.1% in 2022-23 to 7.3% in 2023-24.
Table 6. Entitlement market turnover and returns, major southern Murray-Darling Basin entitlements (outside irrigation corporations), 2023-24.
|
Entitlement type
|
No. traded
|
Volume traded (ML)
|
Estimated turnover value (million)
|
Estimated turnover (%)
|
Average annual gross return (%)
|
|---|---|---|---|---|---|
|
Vic 1A Greater Goulburn HRWS
|
713
|
30,267
|
$120
|
4%
|
1.5%
|
|
Vic 1A Greater Goulburn LRWS
|
370
|
19,874
|
$18
|
5%
|
5.2%
|
|
Vic 6 Murray (Dart to Barmah) HRWS
|
127
|
6,190
|
$28
|
3%
|
1.2%
|
|
Vic 6 Murray (Dart to Barmah) LRWS
|
80
|
3,107
|
$2
|
3%
|
7.3%
|
|
Vic 7 Murray (Barmah to SA) HRWS
|
675
|
18,929
|
$135
|
3%
|
1.2%
|
|
Vic 7 Murray (Barmah to SA) LRWS
|
130
|
5,198
|
$10
|
3%
|
4.4%
|
|
NSW Murray 10 GS
|
8
|
2,049
|
$4
|
0.2%
|
2.8%
|
|
NSW Murray 10 HS
|
2
|
310
|
$2
|
2%
|
0.6%
|
|
NSW Murray 11 GS
|
28
|
2,390
|
$7
|
1%
|
3.2%
|
|
NSW Murray 11 HS
|
76
|
11,112
|
$101
|
8%
|
0.9%
|
|
NSW Murrumbidgee GS
|
35
|
18,252
|
$45
|
1%
|
3.3%
|
|
NSW Murrumbidgee HS
|
11
|
4,227
|
$37
|
1%
|
0.9%
|
|
SA Murray HS
|
190
|
12,909
|
$94
|
3%
|
1.3%
|
|
Total
|
2,445
|
134,815
|
$603
|
2%
|
Note: The gross average returns are generated using a simple method to inspect market trends, not the performance of a particular investment. See Table Notes.
4.5 Groundwater markets
Groundwater markets continue to see limited activity.
Groundwater markets were quiet again in 2023-24 (Figure 18). Demand for groundwater has been restricted by consecutive years of low surface water prices, with pumping costs outweighing the cost of using surface water on-farm.
Only seven priced entitlement trades were recorded in major groundwater zones (Lower Lachlan, Lower Murrumbidgee, and Lower Murray), one less than last year and the lowest number of priced trades since 2012-13.
The volume traded or transferred (including $0 trades) was the fourth lowest on record at 2,712 ML, down 51% from the volume traded or transferred in 2022-23.
Between 2022-23 and 2023-24, annual VWAPs for:
- Lower Murrumbidgee Deep Groundwater increased by 11%, from $3,928 per ML to $4,062 per ML (although this is an aggregate of three zones).
- Lower Murray Groundwater decreased slightly by 4%, from $2,550 per ML to $2,456 per ML.
- Lower Lachlan Groundwater saw no trades or transfers in 2023-24. There has been no Lower Lachlan Groundwater entitlement trade since April 2022.

Figure 18. Individual water entitlement trades (priced trades only, $0 trades excluded) and volumes (bubble size), major groundwater entitlement markets, 2012-13 to 2023-24.
Source: Aither, 2024. Based on New South Wales Water Register, 2024.
Note: NSW Lower Murrumbidgee Deep Groundwater Source Aquifer is an aggregate of the three zones in this aquifer. This reflects the way in which trades for these entitlements are recorded on the NSW Water Register. See Figure Notes.
4.6 Northern MDB markets
Northern Basin market activity improves.
Northern Basin market activity rose in 2023-24, with volume traded improving by 79% year-on-year to 10 GL. Due to limited connectivity and trades usually associated with land transfers, trade activity for northern Basin entitlements is generally lower than that seen in their southern Basin counterparts. Standalone entitlement trades in major northern MDB markets are shown in Figure 19.
Only 45 trades were processed in the major northern markets this year, making it difficult to gauge true market price through VWAPs alone. Some of the best performing northern Basin entitlements in 2023-24 were:
- NSW Lachlan GS increased 35% from $1,443 per ML to $1,952 per ML. 4.8 GL of trade occurred in the zone. Aither analysis has identified 1.6 GL of trade associated with Commonwealth water purchases.
- NSW Lower Namoi GS increased 120% from $4,414 per ML to $9,703 per ML, from a total volume traded of 1.4 GL. Aither analysis indicates that Commonwealth water purchases have inflated this price, due to 1.1 GL of trade recorded at $9,913 per ML.
Demand for northern Basin entitlements remains strong. Border Rivers GS entitlements (not in Figure 19) have led the charge, with significant buyer interest forcing prices up. There were 23 priced 71M Border Rivers GS entitlement trades in 2023-24. Entitlement values of up to $6,350 (GS-B) and $12,500 per ML (GS-A) were recorded in the zone.

Figure 19 Individual water entitlement trades (priced trades only, $0 trades excluded) and volumes (bubble size) for active northern Murray-Darling Basin entitlement markets, 2010-11 to 2023-24.
Source: Aither, 2024. Based on New South Wales Water Register, 2024.
Note: Data based on 71Q licence-to-licence transfers, which tend to be unrelated to land transfers.
Note: No priced trades were recorded on the NSW Water Register for: 1) NSW Lower Lachlan GS in 2021-22 and 2022-23; and 2) for NSW Gwydir GS in 2021-22, 2022-23, and 2023-24.
Note: Six NSW Namoi GS entitlement trades were recorded in 2023-24 at $6,350 (39 ML), $9,913 (945 ML), $9,913 (43.5 ML), $8,500 (33 ML), $8,500 (68 ML) and $9,913 (213 ML) but due to axis constraints, are not included.
5.1 The year in water policy and management
2023-24 was a year of waiting for the anticipated large Commonwealth buyback to commence. July 2024 sees the beginning of the next phase of Basin Plan delivery.
The Commonwealth Government has continued to action their 2022 election commitment to “Future Proof Australia’s Water Resources” and implement the legislative changes made through the Restoring our Rivers Act (The Act), which was passed in December 2023.
The Act amended both the Water Act 2007 and the Basin Plan 2012 to enable the full delivery of the Basin Plan through additional time, funding, and options.
Legislative amendments to the Basin Plan have allowed for the extension of timeframes for delivery on the Plan, including:
- The deadline to complete Sustainable Diversion Limit Adjustment Mechanism (SDLAM) supply projects has been extended to 31 December 2026.
- Additional time for new SDLAM projects to be proposed by June 2025.
- The deadline for delivering the Basin Plan, including recovering the 450 GL additional water for the environment, is 31 December 2027.
Additional changes to the Basin Plan outline the development of a Constraints Relaxation Implementation Roadmap. This will be delivered by the end of 2024, along with legislative powers for the Minister of Water, and updates to accounting formulas due to the updates to the Basin Plan.
Legislative amendments to the Water Act removed the 1,500 GL purchase cap on water recovery, allowing additional water purchases. Similarly, changes to and extension of the Water for the Environment Special Account (WESA) enabled funds to be used for water purchases. From the original $1.77 billion, in FY25, the account will have approximately $1.35 billion, with the May budget drawing down $613.4 million from this amount.
Amendments to the Water Act implemented the legislative powers necessary to conduct the actions recommended in the ACCC Water Markets Inquiry and the DEECCW Roadmap. These include the necessary legislative powers to enable the ACCC, BoM, and Inspector General of Water Compliance (IGWC) to enact new functions and powers to increase market accountability and transparency.
The Framework for Delivering the Basin Plan In Full was released on 4 July 2024 as an update to the Draft Framework released in January. This provides further insights into the Commonwealth’s strategy to implement the Act. It includes outlining the three key programs enabling the Basin Plan to be delivered in full. It outlines the core principles of enhanced environmental outcomes, minimising socio-economic impacts, and achieving value for money. These programs will be rolled out in an integrated approach from 1 July 2024.
Voluntary Water Purchase Program commences July 2024.
The Commonwealth Government announced in June 2024 that it would commence voluntary water purchases from 15 July 2024 until 11 September 2024, with tenders evaluated between 12 September and November. Their announcement included the release of the Restoring Our Rivers Trading Strategy and the final framework to deliver the Basin Plan in full.
As of June 2024, the Commonwealth had recovered and / or contracted 27.5 GL of water towards the 450 GL target, with an additional 422.5 GL remaining.
The first phase of the program will concentrate on the Southern Connected Basin (SCB) to recover an initial 70 GL/y in targeted catchments, including:
- Murrumbidgee
- NSW Murray
- Vic Murray
- Ovens
- SA Murray
The program has outlined several purchasing approaches available to the Government to allow for the full volume to be recovered. This includes:
- Open and competitive tender.
- Alternative strategies: leasing; purchase via auctions; use of water market intermediaries; market-led approaches via limited tender and donations of water.
- Two expressions of interest (EOI) processes for the 2025 purchasing considerations will commence in August / September 2024 to reflect on the success of the 2024 strategy, consider the willingness of entitlement holders to sell, potential future locations for recovery, and ensure considerations are being made for the future. The EOIs will consider the purchase of leased water rights (encumbered), with further information to be published in the EOI.
The first EOI will target the remaining southern MDB catchments, seeking water rights from areas excluded in the 2024 tender process. Purchasing for this will not occur before mid-2025. The tender documents note that this round will not be seeking to acquire any water rights that are currently leased or form part of a current or future leasing agreement.
The second EOI will target large water portfolios of 20 GL and above from single legal entities. Purchasing for this will not occur until the first quarter of 2025.
Sustainable Communities Package.
The Sustainable Communities package was announced as part of the Commonwealth’s framework for delivering the Basin Plan in full whilst mitigating the socio-economic impacts of water recovery.
In June, the Commonwealth committed $300 million to the program to support delivery costs and regional engagement to identify and develop community initiatives. It will also leverage local and regional development plans, initiatives and investments for delivery.
This will be administered by Basin state governments, with the funding arrangements under negotiation as of July 2024, to be executed and made public within the financial year 2024-25. The program will run for four years from 1 July 2024.
The key outcomes of the program include:
- Help regional communities diversify and build resilience.
- Support communities to build capacity for a different future.
- Respond to local challenges, opportunities and priorities.
- Assist early to manage impacts proactively.
Basin state governments will outline specific guidelines for program activities.
Resilient Rivers Program.
As part of the commitment to recover the full 450 GL of additional water for the environment, the Commonwealth extended the date for water delivery through supply and constraint measures to 31 December 2026. It has provided $520 million in funding, including $494 million made available to Basin states to progress applications for the Resilient Rivers Program, and $27 million available to eligible efficiency projects with the Commonwealth Government.
The program aims to increase investment opportunities in water delivery infrastructure, increase water efficiencies, and achieve savings towards the 450 GL target. It will replace the Off-Farm Efficiency Program.
There are four key streams:
Stream A: Irrigation Infrastructure Operators Modernisation (IIOM).
- Projects to deliver more efficient water delivery networks, including extensions of existing Off-Farm Efficiency Programs.
Stream B: Water Use Efficiency (WUE).
- Project to improve water management infrastructure and enhance efficiencies.
Stream C: Targeted Efficiency.
- Programs for water efficiencies outside of IIOM and WUE streams, including urban, industrial and mining.
Stream D: Water Recovery Projects Start-Ups.
- Seed funding for projects to deliver a range of efficiency activities.
Applications for Streams A, B, and C close on 28 March 2025, and Stream D closes on 30 August 2024.
Alternative water recovery opportunities for the program include the use of:
- Land and water partnerships.
- Changes to water management rules, to be considered case-by-case by the Commonwealth.
- Commercial mechanisms, including leasing water for short-term outcomes.
The first project under the Resilient Rivers Program was confirmed on 8 July 2024, with the government providing $63.5 million to the Murrumbidgee Irrigation Urban Channel Pipelines Proposal. The project will return water to the environment across Griffith and Leeton, with an estimated 2.5 GL to be recovered via the project.
The programs will be run concurrently to maximise the time available to deliver the plan before the 31 December 2026 deadline.
| 4 July | Minister Plibersek requested advice from the MDBA on the likelihood of delivering the Basin Plan by the mandated 30 June 2024 deadline. |
| 25 July | The MDBA advised Minster Plibersek that full implementation of the Basin Plan is not possible by the 30 June 2024 deadline. This comes with the release of the SDLAM Assurance Report, which reaffirms the shortfall in water recovery targets. |
| 15 August | MDBA releases River Murray’s Annual Operating Outlook, outlining its operations plans for the year across possible climatic and rainfall scenarios. |
| 22 August | The Commonwealth Government announced an historic agreement between federal and Basin state governments to deliver the Basin Plan in full. The new agreement sets out key changes, including more time, options, funding, and accountability. The Victorian government is the only Basin state not to sign up to the deal. |
| 6 September | Minister Plibersek makes a speech introducing the Restoring Our Rivers Bill to parliament and commends it to the House. |
| 14 September | The Commonwealth Government announced they will conduct an independent review into IGWC and Murray Darling Basin water compliance. |
| 20 September | The Queensland Government passed the Water Legislation Amendment Act 2023. |
| 22 September | The NSW Government introduced the Lachlan Regional Water Strategy. |
| 30 October | Productivity Commission released its interim report on Basin Plan implementation. |
| 27 November | Commonwealth Government and the Australian Greens released a joint media statement announcing they will work together to pass the Restoring Our Rivers Bill through Parliament. |
| 30 November | Water Amendment Bill passes through the Senate. |
| 7 December | Water Amendment (Restoring Our Rivers) Act 2023 commences.
The NSW Government announced changes to floodplain harvesting licencing |
| 21 December | The Victorian Government released the Goulburn to Murray Post Trade Opportunity Opening Report. |
| 25 January | Bureau of Meteorology launches its new agriculture decision support unit, to assist in farming operations and planning. |
| 30 January | The Commonwealth Government released the Restoring our Rivers Draft framework to deliver 450 GL/y of additional environmental water. This framework outlines the three key programs established to do so: the Resilient Rivers Program, the Sustainable Communities Program, and the Voluntary Water Purchase Program.
The Resilient Rivers Program is the first program to launch. It allows participating state governments to submit proposals for new water-saving infrastructure projects. The final report of the Independent Review of the IGWC has been publicly released. It includes several recommendations for the government to strengthen its role. |
| 22 February | The NSW Government released its Alternatives to Commonwealth Buybacks Plan, outlining its plan to minimise the exposure of regional communities to water purchases, in response to the passing of the Restoring Our Rivers Act. |
| 26 February | The Commonwealth Government released the final report of the Productivity Commission implementation review of the Murray-Darling Basin Plan. |
| 26 March | WaterNSW and the VWR have released their updated water trade information, including information regarding the changes to the Barmah Choke trade opportunity 2024-25. |
| 28 March | The Commonwealth Government announced their intention to deliver on a new National Water Agreement, including updating the National Water Initiative. |
| 3 April | The Commonwealth and ACT governments announced that they have agreed to fulfil the ACT’s water recovery commitments under the Murray-Darling Basin Plan. |
| 4 April | The Productivity Commission released its National Water Reform 2024 interim report. |
| 19 April | New Commonwealth requirements for Murray-Darling Basin water trades |
| 5 May | The Commonwealth Government announced $520 million in funding for drought resistance initiatives. |
| 14 May | The Commonwealth Government released the Budget 2024-25, outlining their fiscal narrative for the next financial year. |
| 11 June | Minister Plibersek announced $300 million in funding for the Sustainable Communities Package, which will support Basin communities in delivering the Basin Plan.
ABARES released their report on the impacts of further water recovery in the southern MDB. |
| 12 June | The final version of the Murray-Darling Basin Water Information Portal is launched, providing information about water availability, storages, groundwater, streamflow, allocation volumes, water markets and water quality. |
| 19 June | The MDBA released their Early Insights Paper for the Murray-Darling Basin Plan Review during the River Reflections conference.
DCCEEW released their draft strategy to improve the health of the Upper Murrumbidgee, detailing the reasons for and core areas of investment and implementation principles, including key programs and their timelines. |
| 22 June | DCCEEW launched the Aboriginal Water Entitlement Program, seeking to acquire water entitlements to support the cultural, economic, social and environmental needs of First Nations People. |
| 27 June | The Productivity Commission released its National Water Reform 2024 final report. |
| 1 July | Funding from the Sustainable Communities Package to implement the Basin Plan became available.
WaterNSW and the VWR enacted trade applications for the Barmah Choke under the new processing protocol. New requirements for water trade information came into effect, including storage of information on priced trades, as legislated under the Restoring Our Rivers Act 2023. Grandfathered tag status exemptions removed from water entitlements. |
| 4 July 2024 | Minister Plibersek announces that water purchases will commence the week of 15 July 2024 and releases the Framework to Deliver the Basin Plan in Full, the Trading Strategy, and the Addendum to the 2012 Basin Plan Regulation Impact Statement. |
Figure 20. Timeline of Murray-Darling Basin water policy events 2023-24.
Source: Aither, 2024.
5.2 Summary of key water policy events
Budget 2024-25.
On 14 May 2024, the Commonwealth Government delivered its 2024-25 Budget, outlining the priorities, policies, and fiscal narrative for the year ahead. The budget was the third handed down by the Government since it was elected in 2022.
Contextually, the budget was drafted ahead of an election year in 2025, which reflects the fiscal narrative outlined in its policies.
The budget provided additional funding for programs within the Murray-Darling Basin to help deliver the Basin Plan (Table 7). However, no additional water recovery funding was provided beyond what was previously provisioned which has not been published due to commercial sensitivities. Much of the new funding allocated to Murray-Darling Basin measures was for implementing the Restoring Our Rivers Act.
This included expanding the availability of funds in the Water for the Environment Special Account (WESA) beyond its original scope, which included recovery of the 450 GL through efficiency measures and easing constraints measures. The account holds approximately $1.35 billion from the $1.77 billion originally provisioned. The budget has seen this balance draw down by $613.4 million , likely to be used to implement measures in the Framework to Deliver the Basin Plan. Additionally, the Sustainable Rural Water Use and Infrastructure Program (SRWUIP) fund has available funding for delivery of the Basin Plan, including water recovery.
Implications for water market participants: The 2024-25 Budget provided the means for implementing policies. Many of these policies are scheduled to start in 2024 or have already commenced; most critical for water market participants is additional Basin Plan water recovery.

Table 7. Breakdown of key funding announcements for water market participants in the 2024-25 Budget.
Barmah Choke updated application protocol.
The Victorian Department of Energy, Environment and Climate Action (DEECA) and WaterNSW have jointly developed a new protocol for managing and processing trade applications for the Barmah Choke opening, to be implemented from 1 July 2024.
The change will improve equity for participants by reducing the impact of differences in each state’s processing approach and systems.
The new protocol sees trade application operations commencing before 10:00am AEST 1 July, with each state maintaining separate application submission processes and queues. An alternative approval processing queue of applications will occur, in which each state will process all applications in the order they are received. If an application is refused, the next queued application from the same state will be assessed until one is approved. This will occur until the IVT limit is reached or one state exhausts their queue.
In a procedure overseen by the MDBA, Victoria was randomly selected to be the first to start processing applications on 1 July 2024. This means NSW will start first in 2025, alternating each year thereafter.
The 2024 opening saw a larger volume transferred via NSW applications (34 GL) than Victoria (22 GL). However, Victoria processed a larger number of applications (31) compared to NSW (29).
Implications for water market participants: Increased transparency in the trade process between Victoria and NSW provides increased equity between water market participants in each state.
ABARES model further water recovery scenarios.
In June, the Australian Bureau of Agricultural and Resource Economics and Sciences (ABARES) released their report on the impacts of further water recovery in the southern MDB.
The report focuses on the effects of further water recovery on irrigated agriculture. It uses three scenarios compared to a baseline scenario to simulate the outputs for allocation prices, water use and gross value of irrigated agriculture production with the given recovery volume inputs. The three modelled volumes include:
- 125 GL
- 225 GL
- 325 GL
The report’s key findings are focused on the mid-point scenario (225 GL), with the low and high-range models following a linear path. The findings for the 225 GL model scenario suggest 3 key outcomes:
1.Water allocation prices will increase—A reduced supply of available water will increase allocation prices by an estimated $45 per ML; however, this will vary between regions.
2.Water use will decrease – Average annual water use across the southern MDB will decrease by 4% (surface and groundwater).
3.Production value will decrease – Average annual value of irrigated production is estimated to decrease across the southern MDB by $111 million, or 2%, per year.
Implications for water market participants: The ABARES model is useful for understanding how further water recovery may affect the southern MDB and the possible implications for irrigated agriculture.
Goulburn to Murray trade review.
The Victorian Department of Energy, Environment, and Climate Action (DEECA) and the Victorian Water Register (VWR) released their latest Goulburn to Murray Post Trade Opportunity Opening Report in July 2024, after their last report in December 2023. The report outlines the key statistics of the trade opening and the trade application process summary.
The Goulburn to Murray trade rule came into effect on 1 July 2022 to sustainably manage trade opportunities for the delivery of water into the lower Goulburn River. The long-term rule works within the operating rules to keep flows lower and more variable over summer and autumn.
Trade announcements occur each year on three key dates:
- 1 July – about 85 GL
- 15 October – up to 30 GL
- 15 December – up to 30 GL
The trade rule applies to allocation trade from the Goulburn, Loddon, Campaspe, and Broken systems to the Victorian Murray and interstate. Under average market conditions, this allows for around 150 GL of trade opportunity.
Further trade opportunities may be created between 15 December and 30 June when back trade occurs from the Murray to the Goulburn.
On 1 July 2024 the opening balance trade opportunity was 84,862 ML. The key trade statistics for the 2024 opening include:
- 99 submitted applications for a total of 235,254 ML.
- 23 applications approved for a total of 84,835 ML.
- Of this, 19 unique seller and 18 unique buyer allocation accounts were used.
- 76 refused applications, 8 due to insufficient allocations in accounts, 68 due to the application volumes exceeding available trade opportunities.
- 83 applications were from the broker portal, with total volume equating to 95% of applications received by Victoria.
- 16 applications made through the MyWater online trading platform.
Of the total 84,835 ML of water in approved applications, only 79 ML was made through online trading platforms, with the remaining 84,756 ML made through the broker portal.
Implications for water market participants: The trade report ensures transparency and accountability of the application process and provides market participants with available data to understand future opportunities. Data from the trade review suggests that applications made through the broker portal are significantly more successful than those made through the online trading platform.
Aboriginal Water Entitlements Program.
In 2018 the Commonwealth Government committed $40 million to help First Nations communities in the Murray-Darling Basin invest in water for cultural and economic purposes. In 2023 the Government increased the program’s funding to $100 million as part of the Restoring Our Rivers Act 2023.
The program will look to purchase entitlements that align with its objectives, including:
- Acquiring surface water entitlements to benefit MDB First Nations.
- Purchases ensure connectivity underpinned by wealth generation.
- Promoting geographical equitable access.
- Connectivity and usability to allow for cultural and economic outcomes on Country.
- Achieving value for money.
The program will provide greater recognition of First Nations values and uses of water, address historic water access inequity, and support cultural, social, economic, spiritual, and environmental well-being.
In June 2024 Minister Plibersek announced the interim governance body and strategic purchasing framework for the purchase of entitlements starting in 2024.
The program has outlined several purchasing strategies to be utilised, including:
- The use of market intermediaries.
- Expression of Interests – open and limited tender options.
- Market – led proposals.
- Gifting opportunities.
- Mixed procurement methods – to maximise effectiveness and efficiency of acquisitions.
The interim governance body, consisting of an Advisory Group and Directorate, has been appointed for 12 months until the water purchased can be transferred to an enduring water-holding model.
Implications for water market participants: AWEP program will commence water purchases in 2024, meaning it will run concurrently with the Commonwealth’s water recovery purchases to deliver the Basin Plan.
MDBA early insights – Basin Plan Review.
In June 2024, the MDBA released its Basin Plan Review Early Insights Paper, detailing its approach to addressing the Basin’s challenges and the major issues identified.
The paper emphasises the importance of stakeholder engagement, data-backed decisions, and scientific inputs to evaluate the Basin Plan’s performance over the past twelve years. This approach is to improve First Nations rights and interests in the Basin, recalculate SDL and prepare for the impacts of climate change.
The paper nominates five key areas of challenge:
- Assessing the Basin Plan environmental outcomes – The MDBA will rely on updated river modelling, condition reporting, hydro climatology, and First Nations peoples’ science and knowledge to understand the past twelve years of environmental outcomes under the Basin Plan.
- Preparing for a range of plausible climate futures – Uncertainty around future climate scenarios will require the review to manage certain at-risk parts of the Basin Plan, which may need to be updated to respond to climate change.
- Managing the northern Basin—Improving the Basin Plan’s ability to manage the unique environmental, regulatory, and infrastructure challenges of the northern Basin.
- Building on and simplifying the Basin Plan—The MDBA has acknowledged the need to focus on simplifying and improving aspects of the Basin Plan, such as WRP development and accreditation, to support Basin management outcomes.
- Moving beyond ‘just add water’ – Acknowledging that environmental water management is important in ensuring environmental outcomes from the Basin Plan.
The Basin Plan Review is scheduled to be completed by 2026.
Implications for water market participants: The Basin Plan Review will outline the next decade of water market reform and allow for updated practices to respond to the current climate.
Productivity Commission National Water Reform 2024 Inquiry Report.
In July 2024, the Productivity Commission (PC) released its National Water Reform 2024 Inquiry Report. The report sets out the PC’s findings and recommendations for renewing the 2004 National Water Initiative (NWI) and assessing jurisdictions’ progress towards achieving its objectives and outcomes.
The PC found that NWI has served Australia well as a foundation for water management, but there is an urgent need for a renewed and updated NWI in light of pressing water security challenges. It recommended that a renewed NWI should:
- Improve and expand on the existing agreement while retaining its foundations.
- Include modernised objectives, agreement structure, enhanced elements, and improved governance arrangements.
- Include a greater focus on planning for water security in a variable and changing climate.
- Provide an enhanced commitment to the participation of First Nations peoples in water management.
In its assessment of jurisdictions’ progress towards achieving the objectives and outcomes of the NWI, the PC found that many of the actions under the NWI are complete, and most jurisdictions continue to progress in implementing their remaining and ongoing commitments.
Implications for water market participants: The Productivity Commission’s renewal advice will directly inform a future National Water Agreement, expected later in 2024 or 2025.
6.1 Climate and rainfall outlook
Neutral to above-average rainfall conditions forecast for the start of 2024-25.
Rainfall outlooks for 2024-25 indicate that neutral to wetter conditions are expected throughout the MDB through to the end of 2024. International meteorological agencies are conflicting as to whether the Pacific Ocean will move into La Nińa conditions. The Bureau of Meteorology (BoM) is the least aggressive, predicting neutral conditions, whereas US agencies suggest a relatively strong La Nińa.
With 2024-25 now underway, rainfall has been below-average so far in the southern Basin (Figure 21). The current three-month rainfall outlook indicates at least a 50% chance of rainfall exceeding the median across most of the MDB (Figure 22).
BoM models also suggest a 50% chance of a La Niña event forming later in the year. However, this is based on early signs that likely have limited reliability. La Niña typically increases winter-spring rainfall in eastern Australia.
BoM models also indicate that an increased chance of a negative Indian Ocean Dipole (IOD) in spring. The outlook beyond this period remains uncertain. A negative IOD usually drives above average rainfall in southern Australia.

Figure 21. One-month rainfall deciles, Murray-Darling Basin, July 2024 (issued 31 July 2024).
Source: Aither, 2024. Based on Bureau of Meteorology, 2024.

Figure 22. Three-month rainfall outlook (issued 25 July 2024).
Source: Aither, 2024. Based on Bureau of Meteorology, 2024.
6.2 Allocation market outlook
High opening allocations for 2024-25 but lower than last year.
Despite varied rainfall conditions, near full storages meant most entitlements in the southern MDB had high opening allocations, but lower than their 2023-24 opening allocations:
- Opening allocations were 69% for Vic Goulburn HRWS and 63% for Vic Murray HRWS. While lower than last year, these were still the second and third highest opening allocations since 2015-16 respectively.
- Similarly, opening allocations were 35% for NSW Murray GS (third highest) and 28% for NSW Murrumbidgee GS (fourth highest) since 2015-16.
- SA Murray HS opened at 100% for the fourth consecutive year.
This means that opening water availability decreased from 2023-24, with an estimated 2,729 GL of water available on 1 July 2024 (2023-24 estimated 3,450 GL).
Carryover volumes on 1 July were similar to 2023-24. Aither’s estimates approximately 2,125 GL of water was carried over into the new water year (down 3%). While Victorian storage capacity is near full, the risk of spill has decreased in recent months.
Total water available on major southern MDB entitlements is approximately 4,900 GL, lower than 2022-23 and 2023-24 but higher than the previous two years.

Figure 23. Opening allocations made to major southern Murray-Darling Basin entitlements, 2021-22, 2022-23, 2023-24 and 2024-25.
Source: Aither, 2024. New South Wales Department of Planning, Industry and Environment, 2024; Northern Victoria Resource Manager, 2024; South Australian Department for Environment and Water, 2024.
Note: In-text estimates of the volume of water allocated and carryover volumes include zones Vic 1A Greater Goulburn, Vic 6 Murray, Vic 7 Murray, NSW Murray and NSW Murrumbidgee. See Notes and Figure Notes sections for further details.
Allocations to entitlements are likely to be high, meaning lower allocation prices.
In early 2024-25, allocation prices in the lower Murray are around $135, $125 in the Murrumbidgee, $85 in the Goulburn, and $90 in the upper Murray.
Another year of high early season allocations, combined with high carryover volumes similar to previous years means irrigators can continue to have confidence in water availability. If at least average flows eventuate, consumptive water availability could reach around 6,655 GL by the start of the peak irrigation season (Table 7).
This year’s forecast is slightly higher than last year’s available volume (about 6,630 GL) by early-December. This is driven by slightly higher forecast allocations to NSW Murrumbidgee GS compared to last year (54% forecast this year compared to 46% allocated last year). Improved allocations to this entitlement require early-season water use to create airspace in dams.
Aither’s view is that allocation prices in the next few months will be mainly driven by the climatic outlook and rainfall conditions. Noting BOM’s current climatic outlook at the time of writing (July 2024) is neutral, wetter conditions could see southern MDB allocation prices between $50 – $90 per ML. Whilst drier conditions would result in higher prices during the water year, the outlook for 2025-26 will be more influential on allocation prices from April to June.
Table 7. Peak irrigation season outlooks for 2024-25 based on inflow scenarios (as of 17 July 2024).
|
|
Wet - See note
|
Average - 50 per cent change of exceeding
|
Dry - 90 per cent change of exceeding
|
Extreme Dry - 99 per cent change of exceeding
|
Est. of consumptive water available (GL) - Average inflows
|
|---|---|---|---|---|---|
|
Vic 1A Goulburn HRWS
|
100%
|
100%
|
100%
|
84%
|
677
|
|
Vic 6 Murray HRWS
|
100%
|
100%
|
100%
|
73%
|
209
|
|
Vic 7 Murray HRWS
|
100%
|
100%
|
100%
|
73%
|
672
|
|
NSW Murray 10 HS
|
100%
|
100%
|
97%
|
97%
|
18
|
|
NSW Murray 10 GS
|
110%
|
110%
|
53%
|
42%
|
1,030
|
|
NSW Murray 11 HS
|
100%
|
100%
|
97%
|
97%
|
146
|
|
NSW Murray 11 GS
|
110%
|
110%
|
53%
|
42%
|
278
|
|
NSW Murrumbidgee HS
|
95%
|
95%
|
95%
|
95%
|
335
|
|
NSW Murrumbidgee GS
|
63%
|
54%
|
33%
|
33%
|
763
|
|
SA Murray HS
|
100%
|
100%
|
100%
|
100%
|
401
|
|
Total
|
|
|
|
|
4,529
|
|
Total including estimate of carryover
|
|
|
|
|
6,655
|
Note: There is some variation in the scenarios released by the state governments. The wet outlook is shown for NSW entitlements (25% chance of exceeding), and the wet outlook is shown for Victorian entitlements (10% chance of exceeding.
Note: Outlook months used to estimate the volume of water allocated by peak irrigation season are 1 November for NSW entitlements and 15 December for Victorian entitlements as published in the respective allocation statements released on 15 July 2024.
6.3 Entitlement market outlook
The outlook is very favourable for entitlement prices for those that participate in the Commonwealth water recovery program. The buyback started with a 70 GL program targeting catchments in the Murrumbidgee and Murray systems, starting mid-July 2024. Separately, the Commonwealth also launched the Aboriginal Water Entitlements Program in the Murray-Darling Basin, with $100 million allocated to acquire water entitlements for MDB First Nations. These developments are likely to underpin entitlement prices, adding upward price pressure.
However, Aither observed significant reductions in entitlement prices in 2023-24 driven by poor economic conditions in the form of higher interest rates and low commodity prices. There is the potential for a two-tiered entitlement market with the Commonwealth buying entitlements at above-market prices, while other market participants continue trading entitlements at reduced prices. The big question is what happens when the Commonwealth stops purchasing.
High reliability and high security entitlement markets
In the last 12 months, irrigators, especially wine grape producers in the lower Murray, have been selling entitlements to support wider business operations. Despite easing trade restrictions with China in recent months, challenging economic conditions are expected to persist in the winegrape sector. Lower almond prices will likely continue in the coming months, putting pressure on producers and slowing down new investment. Recently, entitlement buyers have been very selective with their purchasing, tending to be opportunistic and seeking entitlements at a discount to previously high prices.
Simultaneously, the current 70 GL Commonwealth buyback targeting southern MDB entitlements also puts upward pressure on entitlements. Trade and transfer volumes for major southern MDB entitlements in 2023-24 are also at their lowest level since 2009-10. This points to a reduced supply of such entitlements on the market, with potential sellers waiting for the Commonwealth to enter.
Overall, these differing signals point to softening entitlement prices in the short-term from current weak economic conditions. However, as the Commonwealth begins progressing its buyback of 422.5 GL to meet the 450 GL target (as of June 2024), this can put upward pressure on prices. The high reliability of these entitlements and their ability to deliver water to the environment, combined with the opportunity to buy at a potential discount from under-pressure irrigators, can be an attractive proposition to the Commonwealth in meeting their environmental targets via water purchases.
Low reliability and general security entitlement markets.
Compared to high-security entitlements, prices for general security entitlements are unlikely to soften despite economic headwinds. The lower price of these entitlements while still being allocated water can make these entitlements of interest to the Commonwealth as part of a buyback compared to high security and high reliability entitlements.
General security entitlements are less likely to be held by distressed winegrapes producers who usually hold high security entitlements due to their reliability. This means there is less downward pressure on these entitlements from economic difficulties.
Prices for low reliability entitlements are unlikely to soften, given they are usually valued for the ability to carryover water between water years. At the time of writing (mid-August 2023), forecast neutral conditions and lower opening allocations on 1 July than in previous years continue driving demand for carryover space. This shows how carryover remains an important risk management tool for market participants during a dry period. However, the Commonwealth is likely less interested in these entitlements for an environmental buyback as they are usually not allocated water compared to general security entitlements.
Three years of strong allocations to general security entitlements have resulted in continued demand for these entitlements. With cotton prices still strong, good opening allocations and a healthy outlook for 2024-25, demand for general security entitlements is likely to remain high for the foreseeable future.
6.4 Policy and regulatory influences
Basin Plan water recovery through buyback will be a major market influence over the next 2-3 years.
The Commonwealth Government will likely be very active in water markets over the next three years to meet the revised deadline for full delivery of the Basin Plan by December 2027.
Commonwealth efforts have commenced with the opening of programs to deliver the Basin Plan, starting with applications for the Resilient Rivers Program on 30 January and the first tender for water purchases on 15 July.
Applications for the Resilient Rivers Program are being run via four streams and must be submitted by the end of March 2025. The program will allow for the delivery of additional water through water-saving and efficiency measures.
The first round of tenders for water recovery through Voluntary Water Purchases will be open between 15 July and 11 September 2024. The required 12-month validity on offers may reduce the volumes offered in the spot market through 2024/25. This requirement may also reduce the number of vendors willing to offer or the volume offered.
The two additional EOIs will open in August/September, and the expected start time for their subsequent tenders is in 2025, one in the first quarter and the second in mid-2025.
The Restoring Our Rivers Act extended delivery of SDLAM projects to 31 December 2026, allowing new SDLAM projects to be notified to 30 June 2025. The last annual SDLAM assurance report was released on 25 July 2023. This report advised the Government that delivery of the Basin Plan by the original 30 June 2024 deadline was not possible and anticipated a shortfall on the higher end of the forecasted 190 GL to 315 GL.
In 2026, the MDBA will commence reconciling SDLAM projects using the method prescribed under the Basin Plan or an alternative method agreed upon by the Basin Officials Committee and the MDBA. If the reconciliation results in a shortfall, the Commonwealth Government may initiate another round of water purchases to compensate for the shortfall.
Water market reforms.
In October 2022, the Commonwealth Government released the Water Market Reform: Final Roadmap. The Restoring Our Rivers Act 2023 made the necessary legislative changes to the Water Act 2007 to deliver the conduct, integrity, and transparency recommendations for water reform. This includes the legislative powers to enable enforcement, the appointment of regulatory bodies including permitting functions and powers, outlining penalties for non-compliance with the legislation, statutory frameworks, information reporting, and user requirements.
This will enable progress to be made on recommendations for changes to:
- Water Markets Intermediaries Code
- Water Markets Decisions and Insider Trading
- Market Manipulation
- Data Systems and Measures
- Water Markets Information
- Water Markets Data Standards
- Market-sensitive announcements
Implementation has started, with improvements to data accuracy on trade forms implemented from 1 July 2024. These changes see new obligations for the provision of information and the removal of exemptions to grandfathered tags on water entitlements.
Future changes to watch out for from 1 July 2026 include:
- Reforms to water market decisions and announcements and new record-keeping requirements.
- New and strengthened insider trading prohibitions relating to water announcement information.
- New general insider trading prohibitions.
- New market manipulation prohibitions.
- Data and systems reforms, including new data reporting requirements for market information.
Consultation for these reforms will be rolled out from 1 July 2024 through DCCEEW.
References
Aither (2023) Water supply and demand in the southern Murray-Darling Basin (2022 update): An assessment of future water availability and permanent horticulture irrigation water demand. Available at <https://www.waterregister.vic.gov.au/about/news/411-water-supply-and-horticulture-demand-in-the-southern-basin-2022-update>.
Grain Central (2024). NSW cotton regroups after fitful start to season. Available at <https://www.graincentral.com/cropping/nsw-cotton-crop-update>.
Government of South Australia, Primary Industries and Regions SA (2024). SA crop and pasture report 2024-25: Seeding intentions. Available at <https://pir.sa.gov.au/__data/assets/pdf_file/0011/466724/sa-crop-pasture-report-2024-25-seeding-intentions.pdf>.
MDBA (Murray-Darling Basin Authority) (2024). End of day Barmah Choke transactions data. Available at <https://www.mdba.gov.au/managing-water/water-markets-trade/interstate-water-trade/barmah-choke-trade-balance>.
Murray Irrigation Limited (2024). Daily sales data. Available at (current water year only) < https://www.murrayirrigation.com.au/live-daily-sales> [Accessed 28/6/2024].
Northern Victoria Resource Manager (NVRM) (2024). Outlook for the 2024/25 season. Available at <https://nvrm.net.au/outlooks/current-outlook > [Accessed 17/07/2024].
Victorian Water Register (2024). Trade opportunities each year between zones. Available at < https://www.waterregister.vic.gov.au/water-trading/market-insights/trade-opportunities>.
NSW Government (2024), Usage dashboard. Available at <https://water.dpie.nsw.gov.au/our-work/allocations-availability/water-accounting/usage-dashboard> [Accessed 15 July 2024].
About Australia’s Water Markets
Background
In Australia, there are two distinct but related water markets: entitlement markets and allocation markets.
Entitlement markets enable the trading of water entitlements. Water entitlements are ongoing rights to receive an annual share of available water resources in a consumptive pool (e.g., a river system or catchment). They are analogous to a land property right, are generally secure and mortgageable in the same way, and have substantial value. Each catchment typically has a small number of entitlement ‘classes’, and generally all entitlements within a given class are homogenous.
Allocation markets enable the buying and selling of water allocations. Water allocations are the volumes of water allocated to water entitlement holders during the water year (1 July to 30 June). They are a physical good analogous to a commodity and are extracted from water courses and applied as inputs to production or the environment. Based on the water availability and demand at a given time, the value of water allocations per unit varies (usually expressed in $ per megalitre (ML)).
There is no single national Australian water market. Rather, there are many individual markets determined by the hydrological characteristics of physical water systems. Where hydrological connectivity exists, such as in the southern Murray-Darling Basin, trade between markets or zones is possible.
ENTITLEMENT MARKETS
Purpose, use and operation
An entitlement specifies an annual volumetric share of available water resources in a specified catchment or system. Entitlement holders receive their share of the available water resources as water allocations. Allocations vary from year-to-year based on rainfall, inflows, water held in storage and other factors. The entitlement market enables trade in the ongoing right to receive these water allocations. Entitlements can be held by virtually any party in any location.
The entitlement market is largely used by irrigated agricultural producers, but is increasingly being used by investors, water utilities (including urban suppliers) and environmental water holders. These water market participants use the market to modify their long-term arrangements for facilitating production, or meeting environmental requirements, or urban demand.
State government agencies govern the operation of entitlement markets, including rules and regulations regarding how and where trade can occur. Depending on the jurisdiction, other agencies (such as land titles or property registration agencies) will be involved. Third parties (such as exchanges, brokers, and conveyancers) often play a role in facilitating entitlement trade.
Key drivers of market outcomes
The value of water entitlements is largely determined by their reliability characteristics. Reliability characteristics differ across entitlement classes. Higher reliability entitlements provide larger volumes of water allocations over the long term, and more consistently provide water allocations each year than lower reliability entitlements.
Trade in entitlements is related to longer-term production decisions and the characteristics of different irrigated agricultural enterprises, including their tolerance for risk. Producers who may be expanding or contracting production drive market activity, as do market participants who hold large portfolios of entitlements such as investors or large agricultural enterprises. Purchases of water on behalf of the environment have also driven market activity in the past.
Allocation markets
Purpose, use and operation
The allocation market provides the ability to trade physical water between parties for use, further trade, or carryover. Allocation trade can generally only occur between parties who are in trading zones that are hydrologically connected such that water can be delivered (or substituted by other water from a shared storage).
The water allocation market is mainly used by irrigated agricultural producers (including rice, dairy, horticulture, cotton, and others), and environmental water managers. Irrigators use the market to sell water excess to requirements or buy additional water for use during dry periods or when temporarily expanding production. Environmental water holders may similarly buy or sell when they have short-term surpluses or deficits.
Similar to entitlement markets, state government regulators determine annual allocations based on entitlement characteristics (that determine priority and how much water is allocated to individuals), and market rules to manage issues such as connectivity between systems and transmission losses. State governments, either directly or via their water utilities, play a key role in facilitating allocation trade, including ensuring compliance with rules and regulations, and by approving and processing trades. Parties seeking to trade allocations may utilise intermediaries such as water exchanges and brokers.
Key drivers of market outcomes
The volume of water allocated to entitlement holders each year is a key driver of allocation market outcomes (including prices and volumes traded) because it strongly influences the total volume of water available for use or trade. When allocations are low, water is scarce, and prices are high. The opposite is true when allocations are high. Allocation levels reflect broader water availability, including rainfall and inflows in relevant catchments, and volumes held in storages. Other key drivers in allocation markets include conditions in markets for irrigated agricultural products, and conditions in substitute input markets.
Download notes